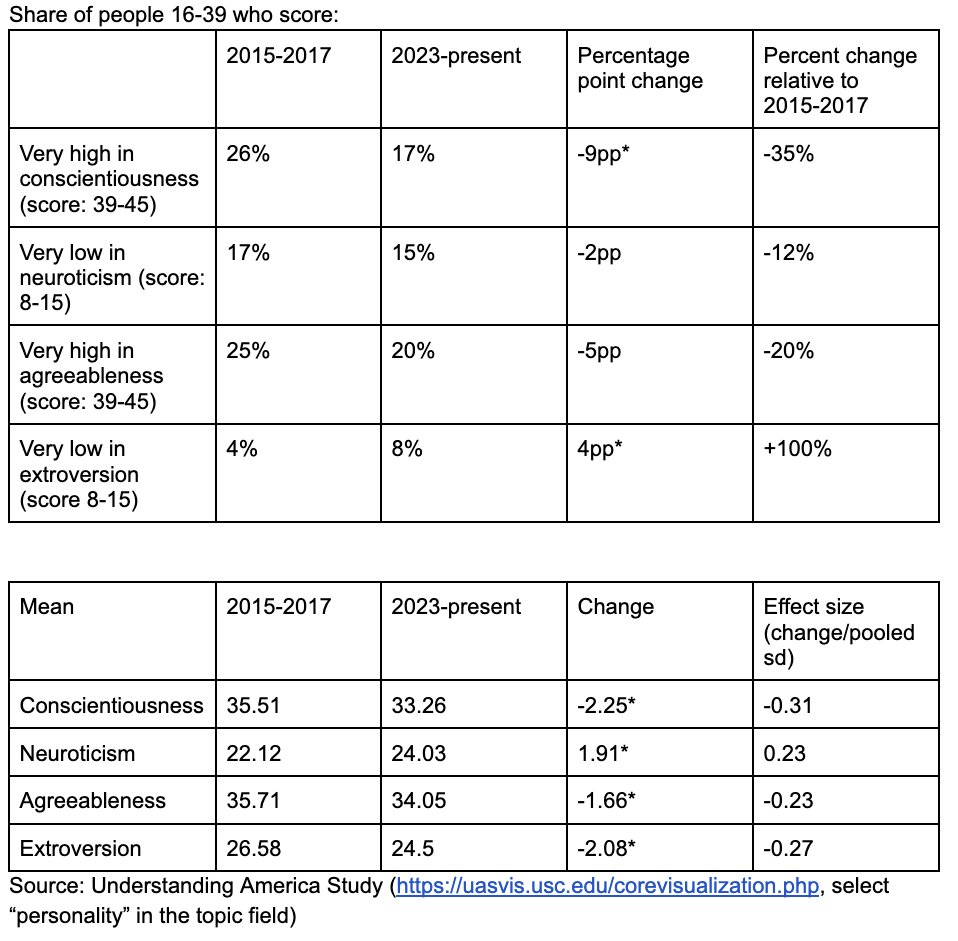
I wanted to describe the size of this change in words, so here's one (based on the tables f/ here: https://t.co/EAHnaioCkx): During 2015-2017, 26% of 16-39-year-olds scored very high in conscientiousness. By 2023-2025, that share had fallen to 17% (a 35% decline).
Like everything @jburnmurdoch makes, this chart is amazing.
The sharp decline in conscientiousness and rise in neuroticism among young people is astonishing.
But also of note: literally every age group has gotten less extroverted in the age of the smartphone
This really happened. Although, I don't rank it as the craziest moment in grad school. For me, it was the moment @djhb20 was joking to Alberto Alesina that my laptop was so crappy that no one would want to steal it at the exact moment (I like to imagine) it was being stolen.
One time I was chatting with @R2Rsquared in the hallway outside the men's room in the economics department and acclaimed actor Elizabeth Shue walked out of the men's room and looked at our surprised faces and said, "The women's room was locked" and walked away.
To put Montana's recent net migration rates in context. This graph shows the state-level distribution by year. MT's recent net migration rates are roughly in line with AZ and FL pre-Great Recession and ND during Bakken boom.
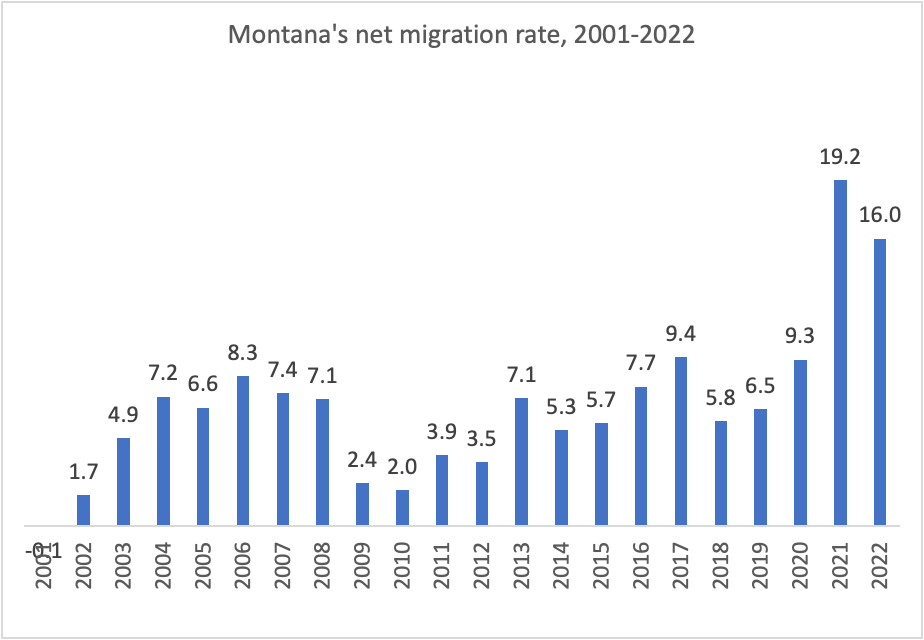
According to new Census est., net migration (people moving in minus people moving out) added 17,804 people to Montana's population between 7/1/21 and 7/1/22. This is down slightly from the year prior (21,083 net migrants), but the net migration rate is still 3x the 2001-2019 avg.
This study combines data for eight well-being measures from 4M respondents from 164 countries and 50 states during 2008-2017. Among all 215 countries/states examined, Montana ranks 12th, and US states take 16 of the top 20 spots.
https://t.co/F0CEgnHCO8
Data from the past decade proves that we're living in a modern society that promotes chronic loneliness.
@DKThomp speaks with @bryceaward about the "friendship recession" that is affecting Americans.
https://t.co/0Fc5kglON0
Relative to 2013, in 2021, the avg. teen spent approx. 11 fewer hrs with friends each week (⬇️64%) and 12 add'l hrs alone (⬆️48%). Over this per., pretty much everyone ⬇️friends and ⬆️alone. It's easy to blame COVID, but most of this shift pre-dates COVID. https://t.co/vz84vFUsEF
@eidietrich There are lots of tradeoffs in the various ways to quantify gerrymandering. At a minimum, I think it is worth including an alternative that focuses only on contested races. R's won 53% of house vote in contested races (similar to their share of US House vote).
@eidietrich For more sophisticated discussions (including some that literally identify who moves into the new houses and who moves into the houses they vacated and so on), see for instance: https://t.co/3hCPEslE7g; https://t.co/up0xfhyz2L; https://t.co/2ZgaXMTxI4
@amandaleggert Rates up appox. 1pp since I made the second graph, so spikes are even higher. Definitely getting outside the range that has existed over the past several decades.
@amandaleggert Here's a diff. view using the Zillow Home Value Index for the value of the average home and rates through a few weeks ago. Calc. annual princ. & int. payment, divide by personal income per capita (no spec. reason for this other than it was available for 2021 when I made this).