Post 3/3
Is this the slow end of America’s “exorbitant privilege”?
Or just another scare markets will shrug off? Drop your take below 👇 What are you watching - JGB yields, the oil curve, or TIC data? @zerohedge@Lukegromen@TheSiriusReport@delalonde@Bloomberg@WSJMarkets
https://t.co/qrOOflJu2I
Post 1/3
Paulson just dropped a “vicious” bond-crash warning on Bloomberg. Japan is repatriating $1.2T in Treasuries.
Gulf oil states are hoarding cash after the Hormuz chaos.
Extreme oil backwardation is the spark. The foreign bid that kept U.S. yields low is cracking. Full breakdown here 👇
[Your Substack link] #Paulson #BondCrash #Treasuries #JapanRepatriation #OilBackwardation
Post 2/3
The yen carry trade that subsidized global borrowing for 15 years is dead.
JGB yields at multi-decade highs.
Gulf SWFs paused new U.S. buys. Paulson says we need a “break-the-glass” emergency plan now. This is exactly the demand-collapse scenario he warned about. #USDebt #Petrodollar #YenCarryTrade #macrondégage
THE $286 BARREL What History Says the Price Should Be, and Why the Screen Still Shows $95
On April 14, at the HSBC Global Investment Summit in Hong Kong, CEO Georges Elhedery said something on live Bloomberg television that should have detonated every energy desk on earth.Thanks for reading! Subscribe for free to receive new posts and support my work.SubscribedIt did not.“The highest I’ve seen, and I’m hoping we don’t see more of that, but the highest I’ve seen is $286 for a barrel of oil that reached Sri Lanka.
This is not a country and an economy that can easily afford these kind of prices sustainably.”Two hundred and eighty-six dollars. For a single barrel. Delivered. While Brent futures closed at $95.61 that same afternoon, and CNBC’s chyron still read “oil near $100.”Nobody moved. The Bloomberg terminal ticked.
The screen said $95.The arithmetic nobody wants to readElhedery laid it out plainly. Middle East crude at origin: $140 to $150. Red Sea rerouting: add $30 to $40 for shipping. Insurance costs: from 25 basis points before the war to 5 percent today, and that 5 percent buys you no war coverage at all. War insurance has been scrapped entirely.Stack those numbers onto Dated Brent physical at $131.97 on April 9, Oman crude at a record $152.58 in March, Dubai crude at $157.66 in early April. The math arrives at $286 for a poor importing nation trying to keep the lights on.This is not a spike.
This is not volatility. This is the terminal divergence between two different commodities that happen to share a name.What the historical record actually saysFive decades of oil shocks provide the only honest framework for projecting where prices go from here. The data is not ambiguous.The 1973 and 1979 oil shocks each removed around five million barrels per day from global supply. In both cases the shock lasted roughly six months.
The Hormuz closure has taken out more than ten million barrels per https://t.co/o0Idj43sra 1973, the embargo removed 4.5 million barrels per day, roughly 7 percent of global supply. By March 1974, oil had risen nearly 300 percent, from $3 per barrel to nearly $12 globally. In inflation-adjusted 2026 terms, that quadrupling from a $66 pre-war baseline would produce a Brent price of approximately $264.The 1979 Iranian Revolution halted roughly 5 million barrels per day of Iranian exports. Prices more than doubled from $14 to over $30 per barrel by 1980, exacerbated by the Iran-Iraq War’s outbreak later that year. Applied from the pre-war $66 baseline, a 1979-style doubling produces $132. We are already past that level in the physical market.From $23 per barrel pre-crisis in 1973, oil rose sixfold to $140 by 1980 in real terms, as the combined effect of the 1973 embargo and 1979 revolution compounded over seven years. A sixfold move from $66 produces $396.
That is not a forecast. It is what history did when a sustained, multi-year supply shock ran its course without resolution.The current shock is not comparable to 1973 or 1979. It is larger.The 1973 oil embargo removed 4.5 million barrels per day from global supply, roughly 7 percent of total consumption at the time. The closure of the Strait of Hormuz is stopping 20 million barrels per day, or approximately one-fifth of the world’s petroleum consumption.On a gross volume basis, no prior event comes close to 2026. The Strait carries approximately 15 percent of global crude supply, more than three times the 1990 Kuwait invasion, nearly double the 1973 Arab embargo, five times the Russian invasion of Ukraine, and more than ten times the 2011 Libyan civil war.Yet Brent’s move from $66 to $119, roughly 65 percent, is smaller than both the 1973 quadrupling and the 1990 doubling. The question the market has not answered is why.Why the screen still shows $95Three factors have contained the oil price response. Offsets driven by pipeline diversion and strategic reserve releases have reduced the net gap. Unlike 1973, there is no cartel floor to hold the price elevated once supply returns. And unlike 1990, the tail risk of a further supply wave is currently https://t.co/Nm1yJzL01l of America analysts have been direct about what the historical record demonstrates: duration is the most important variable. The results of an oil spike lasting six weeks differ greatly from those lasting eighteen months. Persistent inflationary cycles are only consistently produced by long-term, continuous supply disruptions.The futures market has internalized this lesson. It is betting on brevity. On April 7, when Trump announced a two-week ceasefire with Iran, Brent fell more than 15 percent in a single session, the largest one-day drop since the 1991 Gulf War. The market did not wait for the Strait to physically reopen. It priced the prospect of resolution immediately.The physical market did not move. Dubai crude remained at $157. Sri Lanka still paid $286.This is the structural split. Futures are trading diplomacy. Physical is trading barrels. They are no longer the same instrument.The 38-year architecture is brokenSince 1988, Brent and WTI futures have functioned as the nervous system of global energy. Every central bank inflation model, every airline fuel hedge, every sovereign budget in every importing nation anchors itself to these two numbers. The entire post-1973 architecture assumed one thing: that paper price and physical price converge within a narrow band. That arbitrage closes the gap. That the benchmark tells the truth.On April 14, the CEO of one of the world’s largest banks told the world, on Bloomberg television, that the paper price is now off by nearly 200 percent from the physical price for the countries that can least afford the difference.A $95 Brent headline and a $286 delivered barrel are not the same commodity. They are two different markets. The poor are trading in the real https://t.co/s6ukkjxMSq 1973, the shock was concentrated on Western economies, which were the primary targets. In 2026, the most vulnerable economies are the developing Asian markets that have grown fastest over the past 30 years, roughly 80 percent of whose oil imports pass through the Strait of Hormuz. Vietnam holds fewer than 20 days of oil reserves.If the 2022 energy shock was largely a European crisis, 2026 is felt hardest in Asia. More than 40 percent of Asia’s oil passes through the Strait of Hormuz. The continent that was supposed to drive the next decade of fossil fuel demand growth is now the continent with the strongest reason to abandon it. The analogy is European oil demand in 1979, which peaked and never returned.Sri Lanka is not the story. Sri Lanka is the preview.Ceylon Petroleum Corporation has denied the $286 figure and threatened legal action.
This is expected. No government tells its population that it is paying $286 to keep the grid running.The denial does not change what arrived at the port.What matters is what President Dissanayake did in response. He publicly thanked Russia, India, and China on April 8. India delivered 38,000 metric tonnes on March 28. Sinopec is running sustained shipments. Russia has formalized supply arrangements despite US sanctions.Colombo, a capital of 1.7 million people in a country still recovering from a 2022 sovereign default, has accidentally become the first live demonstration of what post-dollar, post-Brent, multipolar energy sourcing looks like in practice. Not in a think tank paper. In actual cargoes arriving at actual ports.
The scenario matrixHistory gives us three precedents and three price outcomes. The variable in every case is duration.Scenario A: 1990 analog. Ceasefire holds, Strait reopens within weeks.
The 1990 Gulf War removed 4.3 million barrels per day. Prices doubled to $42 then collapsed to $20 once US troops secured Saudi infrastructure. In 2026, a genuine ceasefire and physical reopening of Hormuz would trigger a rapid futures collapse, possibly back toward $70 to $80. The physical premium would compress. The $286 print becomes a historical data point rather than a floor.Scenario B: 1973 analog. Disruption persists 6 to 12 months.
Early estimates indicate Qatar’s LNG infrastructure damage could keep 17 percent of global production offline for years. Even an immediate political resolution leaves well restart timelines and over sixty damaged energy sites across the Gulf requiring repair. In this scenario, futures reprice toward physical. The $95 screen converges upward, not the $286 delivered price converging down. Historical precedent: Brent trades toward $150 to $200 within the year.Scenario C: 1973 plus 1979 compounding. Red Sea closure added to Hormuz. Iran has formally warned it will block the Persian Gulf, Sea of Oman, and Red Sea if the US naval blockade holds.
The Houthis have demonstrated operational capacity in Bab el-Mandeb repeatedly. The one scenario that could fundamentally change the contained price response is closure of the Bab el-Mandeb alongside Hormuz. Every alternative routing eliminated simultaneously. In this scenario there is no historical analog. The 1970s produced a sixfold real price increase from a shock one-quarter this size. The arithmetic at full compound disruption puts physical delivered prices beyond current models.
What this means for markets right nowEvery central bank pricing inflation off Brent is flying blind. The benchmark they are using is a futures contract for a barrel that will not arrive, routed through a strait that is blockaded, insured by a policy that excludes war.Economists point to the crises of 1973, 1978, and 2008 as evidence that every significant spike in oil prices has been followed, in some form, by a global recession. Major oil shocks have historically summoned stagflation, the combination of high inflation, stagnant economic growth, and high unemployment that defined the 1970s.The futures market is betting on Scenario A.
It has been betting on Scenario A since March. Meanwhile, the IEA’s emergency architecture has been activated only six times since 1974, and even deployed at maximum scale, the 400 million barrel release cannot cover a sustained closure of the strait.The $286 barrel is also a food price. Farmers are reporting fertilizer costs have tripled. Cattle ranchers report feed costs rising from $1,600 a month to $9,000 a month. These are not commodity footnotes. They are the downstream consequence of a $190 basis gap between paper and physical oil flowing through every supply chain that touches energy inputs, which is every supply chain.
The positioning implicationInvestors holding energy equities, long-dated energy calls, or commodity exposure are not positioned for a price spike.
They are positioned for the repricing of a pricing system. That is a different trade. It is larger, slower, and more structurally durable than any single geopolitical event.The $286 print did not move WTI futures. It should have. The failure of futures to respond to a confirmed $190 basis gap, stated publicly by a G-SIB CEO on Bloomberg television, is itself the signal. Either the futures market reprices violently when the May contract expires on April 21, or it remains anchored to ceasefire hope while the physical market continues to trade in a parallel reality at $157, $200, $286.History is clear about what happens when resolution fails to materialize.
The question is not whether you believe the thesis. The question is whether you believe the Strait reopens on schedule.The Brent benchmark has told the world a $95 story for weeks. Sri Lanka received the $286 chapter.The 1973 world read a $3 screen. It paid $12.
Then $35.Everyone else is still reading yesterday’s screen.This is not investment advice. All content is for informational and educational purposes only. Do your own research. Aivantaiq takes no responsibility for trading decisions made on the basis of this analysis.#IranWar #Hormuz #OilPrice #Options #Trading #XLE #MacroTrading #GeopoliticalRisk #Houthis #RedSea #EnergyTrading #OptionsTrading #Commodities #OOTT #WTI #Brent #MacroInvesting #BlackSwan #Aivantaiq@zerohedge @markets@business@Schuldensuehner@MacroAlf@RaoulGMI @elerianmThanks for reading! Subscribe for free to receive new posts and support my work.Subscribed Share https://t.co/TGtt4R46bf
Down 55%. Talks Failed. Theory Unchanged.
The ceasefire is a fiction. The naval blockade is real. April 22 is the next trigger. Every position I hold was built for exactly this moment.
Where We Stand
Book: -1,713 CHF / -55.10%
I am going to say that plainly and not dress it up. Fifty five percent of the money I put into this book is currently showing as a loss. The peak was +604 CHF on March 30. The current mark to market is the worst it has been since I started building this position in February.
And I have not changed a single element of the thesis.
Not because I am stubborn. Because the facts have not changed. In some cases they have become more extreme in the direction I predicted.
Let me show you exactly what happened, where the book stands today, and why I am holding every position through April 22.
The Week in Facts
Islamabad, April 12. Vance flew to Pakistan for 21 hours of direct US Iran talks, the highest level engagement since 1979. He flew home without a deal.
The sticking point was nuclear. Iran refused to commit to abandoning weapons development. Vance called it Iran’s choice not to accept US terms. Iran called it American bad faith. Neither side scheduled a follow up meeting.
Within hours Trump ordered a full naval blockade of the Strait of Hormuz. US Navy mine clearing operations began. Two guided missile destroyers transited the strait, the first American warships to do so since the war began.
The ceasefire expires April 22. Six days from today. No next round of talks is scheduled. No framework exists for extension. Both sides are pointing fingers and positioning for what comes next.
The strait is not open. It has not been open. In the first 24 hours of the so called ceasefire, one oil tanker transited. One. The pre war baseline was 110 per day.
What the Market Did
Markets rallied on the ceasefire announcement April 8. Oil dropped 13% in a single session, its largest single day fall since 2020. Equities surged. My book went from -776 CHF to -1,698 CHF in four days.
The market priced a world where the ceasefire was real, the talks would succeed, and Hormuz would reopen.
Every one of those assumptions was wrong.
The ceasefire was not a reopening. The talks failed. Hormuz remains blocked. And now a naval blockade has been ordered on top of the existing Iranian mining of the strait.
The market sold the rumour of peace and is about to buy the reality of continued war.
The Portfolio Today
Working:
ZIM JAN27 39.16C x15 is up 27.34% total and up 20% today. Shipping rerouting thesis confirmed. Every container ship avoiding Hormuz adds 14 days to the Asia to Europe route. Freight rates surge. ZIM benefits directly.
ASML JAN27 340P jumped 43% today. The helium semiconductor thesis is activating. Qatar helium offline. Taiwan gets 69% of its helium from the Gulf. No helium means chip fab production cuts. ASML is the most exposed name in the semiconductor capital equipment space.
AAL JAN27 8P is down only 7.35% despite a difficult week. The jet fuel thesis remains intact. European airports faced shortages. The last Gulf jet fuel tanker arrived in Rotterdam April 10. American Airlines burns 30% of its operating costs on jet fuel. At $150 oil that becomes an existential problem.
Loading:
SPY puts across four strikes are down 30 to 42%. They need recession to be formally priced. Kalshi currently prices US recession at 28%. Moody’s AI model sits at 49%. My target is when Kalshi crosses 50%, which I expect around Q1 GDP release April 30. When that happens SPY puts reprice 3 to 5x overnight.
VIX DEC26 200C recovered from a brief mark to zero during the ceasefire euphoria and now shows -39.73%. It is alive. VIX at 19 needs to reach 200 for full activation but the option has 8 months of runway. Any major escalation sends VIX to 40 to 60 first, which reprices these contracts dramatically.
Painful but alive:
EQT 95C down 79.57%, KMI 45C down 69.52%. Natural gas surge has not materialised at the pace I expected. These are not dead. US LNG exports hit record highs as Europe scrambles for supply. The catalyst is sustained Hormuz closure through summer, which depletes European gas storage heading into winter. The September to October window is when these activate.
Dead:
AR JUN26 60C, XLE MAY26 75C, NFE JAN27 25C all at or near zero. These were short dated positions or lottery tickets that did not work. Combined cost was roughly $300. Lesson learned on expiry selection. Every remaining position is JAN27. Nine months of runway minimum.
The Full Book
✅ WORKING ZIM JAN27 39.16C x15 | cost $0.05 | now $0.065 | +27%
⚡ NEW POSITION AAL JAN27 8P x3 | cost $0.67 | now $0.47 | -30%
⏳ LOADING thesis intact, waiting for catalyst ASML JAN27 340P | cost $4.20 | now $1.60 | -62% (+43% today) SPY JAN27 300P | cost $2.18 | now $1.36 | -37% SPY JAN27 285P | cost $2.05 | now $1.19 | -42% SPY DEC26 240P | cost $1.14 | now $0.68 | -40% SPY DEC26 230P | cost $1.03 | now $0.615 | -40% VIX DEC26 200C x10 | cost $0.22 | now $0.135 | -40% AMZN JAN27 125P | cost $2.62 | now $1.15 | -56% AMZN JAN27 100P | cost $1.10 | now $0.48 | -56% TSM JAN27 100P | cost $1.90 | now $0.62 | -67% XLE JAN27 80C x4 | cost $0.63 | now $0.396 | -37% XLE JAN27 90C | cost $0.48 | now $0.172 | -65%
🔴 PAINFUL BUT ALIVE AR JAN27 55C | cost $2.60 | now $1.225 | -53% AR JAN27 60C | cost $2.25 | now $0.875 | -61% AR JAN27 65C | cost $1.55 | now $0.55 | -65% EQT JAN27 95C | cost $3.00 | now $0.62 | -79% KMI JAN27 45C x4 | cost $0.47 | now $0.145 | -69% OESX JAN27 1000P x2 | cost 3.10 EUR | now 0.10 EUR | -97%
💀 DEAD written off AR JUN26 60C x3 | expired worthless XLE MAY26 75C x20 | expired worthless NFE JAN27 25C x7 | near zero
TOTAL BOOK: -1,713 CHF / -55.10% Expected value: +$30,000 to $40,000 (probability weighted by Polymarket and Kalshi) All live positions expire JAN 2027. Nine months of runway.
Why I Am Not Selling
Five reasons.
First, the thesis has not failed. Hormuz is not open. It has never properly opened. One tanker per day is not open. A naval blockade is not open. Iran mines are not open. The ceasefire was a pause in bombing, not a restoration of shipping.
Second, the options have nine months of runway. Every JAN27 position expires January 15, 2027. The war started February 28, 2026. We are 47 days in. Calling this thesis dead at 47 days with 274 days left on the options is premature by any measure.
Third, the expected value is still positive. Probability weighted across scenarios anchored to Polymarket and Kalshi odds, the book has an expected value of approximately positive $30,000 to $40,000. The current mark to market loss of -1,713 CHF does not reflect expected value. It reflects where the market is pricing things today, which I believe is wrong.
Fourth, the Michael Burry parallel holds. In 2007 Burry was down 18% for 18 months before being up 489%. His investors tried to force him to sell. He held because the thesis was intact. My drawdown is worse than his was at the equivalent point. My conviction in the underlying facts is the same as his was.
Fifth, April 22 is six days away. The ceasefire expires. No talks are scheduled. No extension framework exists. The market spent two weeks pricing peace. It is about to price the absence of it.
The Cascade That Kills the Market
This is what I am waiting for and what the market has not yet fully priced.
Hormuz stays blocked through May. European gas storage, currently at 28% capacity against a 90% summer refill target, cannot reach the level needed for winter. By September European gas prices go to record highs. German industrial production cuts deepen. The European recession that has been whispered about becomes official.
Simultaneously US Q1 GDP, released April 30, comes in negative or very close to zero. Kalshi recession odds spike from 28% to 50% plus. SPY puts activate.
The fertilizer shortage that nobody is talking about hits farmers during planting season right now, in April and May. Less fertilizer applied this spring means lower crop yields harvested in autumn. Food prices spike in Q3. Stagflation becomes the consensus view, not a fringe call.
The helium shortage, confirmed by the attack on Ras Laffan, works through the semiconductor supply chain with a three to six month lag. By Q3 chip production cuts are being announced. AI infrastructure spending freezes. Nvidia guides down. Tech stocks fall hard.
All of these happen with my JAN27 options still alive.
What I Am Watching
April 22. Ceasefire expiry. If it expires without extension and without a new round of talks, oil gaps up, VIX spikes, and the book recovers a significant portion of its drawdown in a single session.
April 30. US Q1 GDP advance estimate. If negative or below 0.5% annualised, Kalshi recession odds move sharply higher. SPY puts begin activating.
Kalshi recession odds daily. Currently 28%. My trigger for adding more SPY puts is 40%. My trigger for maximum confidence in the thesis is 50%.
Hormuz tanker count. Follow the Hormuz Letter on X. One to two tankers per day means thesis intact. Ten or more per day means genuine reopening and time to reassess.
The Numbers That Matter
The market says 28% chance of recession. I say 95%.
The market says Hormuz normalises by July at 76% probability. I say 0%.
The market says ceasefire holds through year end at roughly 30% probability. I say 5%.
Every one of those gaps is where the profit in this book lives.
The book is down 55%. The thesis is more confirmed today than it was when I entered.
Stay ahead.
Aivantaiq April 16, 2026
https://t.co/bxD66rCfAW
This is not financial advice. All options trading involves substantial risk of loss. Options can expire worthless. Never invest more than you can afford to lose completely. Do your own research. Aivantaiq takes no responsibility for trading decisions made on the basis of this analysis.
#IranWar #Hormuz #OilPrice #Options #Trading #XLE #MacroTrading #GeopoliticalRisk #EnergyTrading #OptionsTrading #Commodities #OOTT #WTI #Brent #MacroInvesting #BlackSwan #Aivantaiq
@zerohedge@markets@business@Schuldensuehner@MacroAlf@RaoulGMI@elerianm
Thanks for reading! Subscribe for free to receive new posts and support my work.
THE DIP IS A LIE
Why Oil's "Ceasefire Rally" Is the Most Dangerous Trade of 2026
Aivantaiq | April 15, 2026
Everyone is watching oil fall and calling it relief.
WTI is trading around $93 this morning. Brent near $96. Both down sharply from last week's highs and the financial media is spinning it as a de-escalation story. Peace talks. Diplomatic progress. Trump "optimistic."
Don't believe it.
This is what a bear trap looks like before the next leg higher.
The Numbers That Don't Lie
Let's start with where we actually are.
Brent crude began the year at $61 per barrel. By end of Q1, it had reached $118, the largest inflation-adjusted quarterly price increase in data going back to 1988.
Military action on February 28 and the subsequent de facto closure of the Strait of Hormuz triggered a cascade: Iraq, Saudi Arabia, and the UAE shut in production. Attacks on energy infrastructure accelerated the move. Brent crossed $100 on March 12 and kept climbing.
WTI's 52-week range now runs from $54.98 to $117.63. The price has risen 54% year on year.
This is not a spike. This is a structural repricing.
Why Today's "Dip" Is Noise
On Monday, the US Navy commenced a formal blockade of Iranian ports in the Persian Gulf. The blockade directly endangers Iran's oil exports through the Strait of Hormuz, which tracked around 1.7 million barrels per day last month.
Weekend talks in Pakistan collapsed. The US accused Tehran of refusing to curb its nuclear ambitions. Iran reportedly demanded control of the Strait, war reparations, a broader regional ceasefire, and access to frozen overseas assets.
Those aren't negotiating positions. That's a list of maximalist demands designed to buy time.
Trump said talks could restart "within the next two days." Tehran is reportedly considering a temporary pause in Hormuz shipments to facilitate progress.
A temporary pause. Markets are pricing in a peace deal. The physical reality is a blockade.
The Spread. The Gap. The Real Trade.
Here's the mechanic that matters and that almost no one in mainstream finance is talking about clearly:
The Brent WTI spread is a war gauge.
The Brent WTI spread peaked at $25 per barrel on March 31, the highest in over five years, because Brent is exposed to Middle East shipping disruption while WTI is partially insulated by strong US production and inventories.
The EIA expects the spread to peak at $15 per barrel in April as production disruptions reach their maximum, then slowly narrow as Hormuz flows resume.
That's the base case: orderly resolution, phased reopening, spreads normalise by late 2026.
But the base case assumes the talks succeed. They haven't yet.
The EIA forecasts Brent to peak at $115 per barrel in Q2 2026 before easing, and maintains a risk premium throughout its forecast period given uncertainty around future supply disruptions.
Their bull case is $115. Their downside scenario — extended closure, Saudi infrastructure damage, Hormuz transit fees — doesn't appear in the headline number.
America Cannot Fill This Gap
This is the part that doesn't fit the narrative.
The "US as swing producer" story assumes America can simply ramp exports to replace Gulf barrels. It cannot.
US domestic production has been flat. Net crude imports remain around 2 million barrels per day. The logistical ceiling on export throughput from Gulf Coast terminals adds at most 1 million barrels per day in incremental supply, nowhere near enough to replace the Gulf shortfall.
OPEC+ output fell by 7.9 million barrels per day in March alone.
Headlines calling the US a "net energy exporter" are technically accurate but strategically misleading. They count ethane, propane, and natural gas liquids, none of which can fuel the planes, trucks, and power grids that run the global economy.
The tankers showing up empty to US ports aren't a bullish signal. They're just the shipping cycle. They always arrive empty.
The Crack Spread: Where the Real Money Is
One mechanic getting almost zero mainstream coverage: crack spreads.
The crack spread is the margin between the crude oil input cost and the refined product output price: gasoline, diesel, jet fuel. When crude tightens faster than products adjust, refiners' margins explode. Right now, that's exactly what's happening.
The EIA forecasts retail gasoline to peak at nearly $4.30 per gallon in April. Diesel prices are forecast to peak at over $5.80 per gallon, the highest in real terms in years.
US Gulf Coast refiners, positioned to receive WTI priced crude while selling into a Brent priced export market, are seeing margins they haven't seen in years. The spread between input and output is the trade, not just the headline crude price.
This is why XLE, KMI, and the midstream complex aren't just energy plays right now. They're inflation arbitrage machines.
The Scenario That Isn't Being Priced
The market is currently pricing: ceasefire holds, talks resume, Hormuz reopens, prices fall back toward $80 by Q4.
Here's what's not being priced:
Scenario B: Talks collapse again. Blockade hardens. Iran begins formally charging transit fees (Trump has already warned Tehran against this). Saudi Arabia, whose infrastructure was already hit reducing capacity by around 600,000 bpd, faces further attacks. The Ras Laffan LNG terminal, which also handles the world's second largest helium supply, gets targeted. Suddenly this isn't just an oil crisis.
Even in a best case scenario, restoring full production capacity will take months, with full normalization potentially delayed until late 2026.
The base case has a ceiling. The tail risk has no ceiling.
What I'm Watching
Three data points that will move this faster than any headline:
Tanker tracking. AIS data on vessels transiting or avoiding Hormuz is the leading indicator, not the lagging price.
EIA weekly inventory builds. API reported US crude inventories increased by 6.1 million barrels last week, the eighth consecutive weekly build. That's the only bearish data point in this picture, and it's a US domestic number, not a global one.
Any Saudi statement on production capacity. A second infrastructure hit would remove the last marginal buffer.
The Bottom Line
Oil is down today because people want it to be over.
The physics don't care what people want.
Twenty percent of global oil flows remain disrupted. The blockade is active. Talks are stalled. The spread between available supply and global demand hasn't closed. It's widened. And the US cannot fill the gap no matter how many tankers it loads.
The dip is an opportunity, not a resolution.
The spread only widens from here until the physical balance changes. Watch the strait, not the headlines.
This is not investment advice. All content is for informational and educational purposes only. Do your own research. Aivantaiq takes no responsibility for trading decisions made on the basis of this analysis.
#IranWar #Hormuz #OilPrice #Options #Trading #XLE #MacroTrading #GeopoliticalRisk #Houthis #RedSea #EnergyTrading #OptionsTrading #Commodities #OOTT #WTI #Brent #MacroInvesting #BlackSwan #Aivantaiq
@zerohedge@markets@business@Schuldensuehner@MacroAlf@RaoulGMI@elerianm https://t.co/2D3cch4u8g
THE DIP IS A LIE
Why Oil's "Ceasefire Rally" Is the Most Dangerous Trade of 2026
Aivantaiq | April 15, 2026
Everyone is watching oil fall and calling it relief.
WTI is trading around $93 this morning. Brent near $96. Both down sharply from last week's highs and the financial media is spinning it as a de-escalation story. Peace talks. Diplomatic progress. Trump "optimistic."
Don't believe it.
This is what a bear trap looks like before the next leg higher.
The Numbers That Don't Lie
Let's start with where we actually are.
Brent crude began the year at $61 per barrel. By end of Q1, it had reached $118, the largest inflation-adjusted quarterly price increase in data going back to 1988.
Military action on February 28 and the subsequent de facto closure of the Strait of Hormuz triggered a cascade: Iraq, Saudi Arabia, and the UAE shut in production. Attacks on energy infrastructure accelerated the move. Brent crossed $100 on March 12 and kept climbing.
WTI's 52-week range now runs from $54.98 to $117.63. The price has risen 54% year on year.
This is not a spike. This is a structural repricing.
Why Today's "Dip" Is Noise
On Monday, the US Navy commenced a formal blockade of Iranian ports in the Persian Gulf. The blockade directly endangers Iran's oil exports through the Strait of Hormuz, which tracked around 1.7 million barrels per day last month.
Weekend talks in Pakistan collapsed. The US accused Tehran of refusing to curb its nuclear ambitions. Iran reportedly demanded control of the Strait, war reparations, a broader regional ceasefire, and access to frozen overseas assets.
Those aren't negotiating positions. That's a list of maximalist demands designed to buy time.
Trump said talks could restart "within the next two days." Tehran is reportedly considering a temporary pause in Hormuz shipments to facilitate progress.
A temporary pause. Markets are pricing in a peace deal. The physical reality is a blockade.
The Spread. The Gap. The Real Trade.
Here's the mechanic that matters and that almost no one in mainstream finance is talking about clearly:
The Brent WTI spread is a war gauge.
The Brent WTI spread peaked at $25 per barrel on March 31, the highest in over five years, because Brent is exposed to Middle East shipping disruption while WTI is partially insulated by strong US production and inventories.
The EIA expects the spread to peak at $15 per barrel in April as production disruptions reach their maximum, then slowly narrow as Hormuz flows resume.
That's the base case: orderly resolution, phased reopening, spreads normalise by late 2026.
But the base case assumes the talks succeed. They haven't yet.
The EIA forecasts Brent to peak at $115 per barrel in Q2 2026 before easing, and maintains a risk premium throughout its forecast period given uncertainty around future supply disruptions.
Their bull case is $115. Their downside scenario — extended closure, Saudi infrastructure damage, Hormuz transit fees — doesn't appear in the headline number.
America Cannot Fill This Gap
This is the part that doesn't fit the narrative.
The "US as swing producer" story assumes America can simply ramp exports to replace Gulf barrels. It cannot.
US domestic production has been flat. Net crude imports remain around 2 million barrels per day. The logistical ceiling on export throughput from Gulf Coast terminals adds at most 1 million barrels per day in incremental supply, nowhere near enough to replace the Gulf shortfall.
OPEC+ output fell by 7.9 million barrels per day in March alone.
Headlines calling the US a "net energy exporter" are technically accurate but strategically misleading. They count ethane, propane, and natural gas liquids, none of which can fuel the planes, trucks, and power grids that run the global economy.
The tankers showing up empty to US ports aren't a bullish signal. They're just the shipping cycle. They always arrive empty.
The Crack Spread: Where the Real Money Is
One mechanic getting almost zero mainstream coverage: crack spreads.
The crack spread is the margin between the crude oil input cost and the refined product output price: gasoline, diesel, jet fuel. When crude tightens faster than products adjust, refiners' margins explode. Right now, that's exactly what's happening.
The EIA forecasts retail gasoline to peak at nearly $4.30 per gallon in April. Diesel prices are forecast to peak at over $5.80 per gallon, the highest in real terms in years.
US Gulf Coast refiners, positioned to receive WTI priced crude while selling into a Brent priced export market, are seeing margins they haven't seen in years. The spread between input and output is the trade, not just the headline crude price.
This is why XLE, KMI, and the midstream complex aren't just energy plays right now. They're inflation arbitrage machines.
The Scenario That Isn't Being Priced
The market is currently pricing: ceasefire holds, talks resume, Hormuz reopens, prices fall back toward $80 by Q4.
Here's what's not being priced:
Scenario B: Talks collapse again. Blockade hardens. Iran begins formally charging transit fees (Trump has already warned Tehran against this). Saudi Arabia, whose infrastructure was already hit reducing capacity by around 600,000 bpd, faces further attacks. The Ras Laffan LNG terminal, which also handles the world's second largest helium supply, gets targeted. Suddenly this isn't just an oil crisis.
Even in a best case scenario, restoring full production capacity will take months, with full normalization potentially delayed until late 2026.
The base case has a ceiling. The tail risk has no ceiling.
What I'm Watching
Three data points that will move this faster than any headline:
Tanker tracking. AIS data on vessels transiting or avoiding Hormuz is the leading indicator, not the lagging price.
EIA weekly inventory builds. API reported US crude inventories increased by 6.1 million barrels last week, the eighth consecutive weekly build. That's the only bearish data point in this picture, and it's a US domestic number, not a global one.
Any Saudi statement on production capacity. A second infrastructure hit would remove the last marginal buffer.
The Bottom Line
Oil is down today because people want it to be over.
The physics don't care what people want.
Twenty percent of global oil flows remain disrupted. The blockade is active. Talks are stalled. The spread between available supply and global demand hasn't closed. It's widened. And the US cannot fill the gap no matter how many tankers it loads.
The dip is an opportunity, not a resolution.
The spread only widens from here until the physical balance changes. Watch the strait, not the headlines.
This is not investment advice. All content is for informational and educational purposes only. Do your own research. Aivantaiq takes no responsibility for trading decisions made on the basis of this analysis.
#IranWar #Hormuz #OilPrice #Options #Trading #XLE #MacroTrading #GeopoliticalRisk #Houthis #RedSea #EnergyTrading #OptionsTrading #Commodities #OOTT #WTI #Brent #MacroInvesting #BlackSwan #Aivantaiq
@zerohedge@markets@business@Schuldensuehner@MacroAlf@RaoulGMI@elerianm https://t.co/2D3cch4u8g
The Oil Market Just Broke in Two. And There Is No Scenario Where It Fixes Itself Quickly.
Every path from here widens the gap between the price of paper oil and the price of real oil. Here is the math.
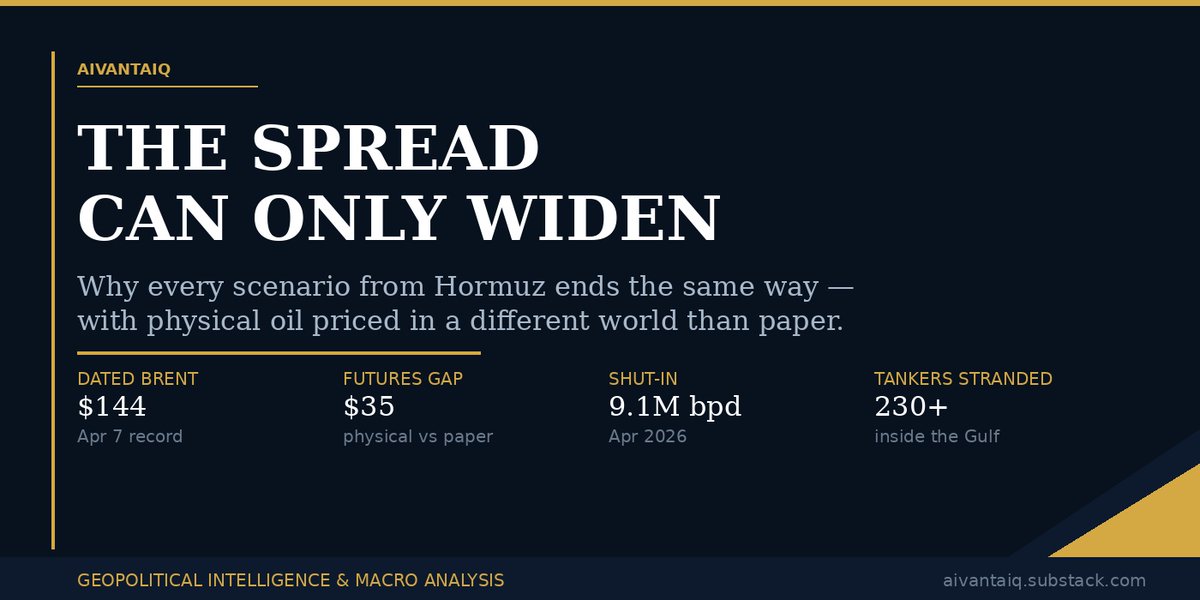
There is a number most oil traders are watching. It is not $100. It is not even $144. It is $35.
That is the gap that opened on April 7 between Dated Brent (the price for an actual barrel of crude you can load onto an actual tanker) and the Brent futures contract (a financial promise of oil that may or may not materialise on time). On April 7, Dated Brent hit a record $144.42 per barrel. Futures were trading near $109. The physical market and the paper market had not just diverged. They had split into two entirely different realities.
This article argues one thing: no matter what happens next, that spread can only widen.
Ceasefire or blockade. Talks or strikes. The structural dynamics now in motion are irreversible in the short term. Here is why.
The Architecture of a Broken Market
Before the war, the oil futures curve was in gentle contango. Near-term contracts at roughly $60, back months in the mid-$60s. Normal. Boring. Comfortable.
That is now ancient history.
Today the curve is in extreme backwardation. Prompt WTI trades near $99 to $104. By late 2026, the same curve drops to the mid-$70s. By 2030, it approaches the high $50s. The market is saying in the clearest possible language: this is a shock, not a permanent regime. It will pass.
The physical market disagrees violently.
Buyers paying for real barrels (cargoes that need to actually move, not settle in cash) are currently paying $37 to $40 above futures. The Jun to Dec 2026 Brent spread sits at roughly $18. The Jun26 to Jun27 spread: $22. This is not a quirk. This is the market telling you that whoever controls the Strait of Hormuz controls the pricing mechanism for roughly 20% of global seaborne oil trade.
Right now, that is Iran.
Why the Ceasefire Made the Spread Worse
When the two-week ceasefire was announced on April 7, futures fell more than 16% in a single session. WTI collapsed to $94.41. The paper market exhaled. Relief rally. Mission accomplished, or so the algos thought.
The physical market barely moved.
Why? Because the logistics of reopening the Strait of Hormuz cannot be resolved in two weeks. Amrita Sen of Energy Aspects put it plainly: Middle East oil producers have shut down 13 million barrels per day because tanker traffic has collapsed. Most tankers are now pointing toward the United States to pick up oil there. Redirecting those ships back to the Gulf could take until June.
Meanwhile, 230 loaded oil tankers were sitting stranded inside the Gulf as of April 9, unable to move. The ceasefire held for roughly 48 hours before Iran resumed restricting and conditioning transit. Traffic never recovered above a handful of vessels per day, versus more than 100 daily in the pre-war period.
The ceasefire did exactly what a ceasefire in this situation always does: it collapsed the futures price while leaving the physical reality unchanged. The spread widened.
The Blockade Scenario: The Spread Explodes
On April 12, JD Vance walked out of Islamabad. The talks failed over Iran's refusal to provide an affirmative commitment against nuclear weapons development, its insistence on maintaining funding for regional proxies, and the question of Hormuz transit tolls.
Trump's response was immediate. On April 13, the US Navy began implementing a blockade of all maritime traffic entering and exiting Iranian ports. CENTCOM clarified that the blockade would not impede freedom of navigation for non-Iranian ports, but in practice
every ship captain, every insurer, and every oil major now faces a binary question: do you risk transiting a contested strait where the IRGC has already attacked 21 merchant vessels and laid sea mines?
The answer, overwhelmingly, has been no.
Brent jumped over 7% to $102 when the blockade was announced. WTI hit $104. Iran's parliamentary speaker told Trump: "If you fight, we will fight." The IRGC declared the strait under "full control" and warned that any military vessel approaching would receive a "severe response."
In this scenario (which is the current scenario as of this writing) the physical supply disruption deepens further. Production shut-ins, already at 9.1 million barrels per day in April, face further upward pressure. The $35 physical-to-futures gap does not narrow. It is more likely to approach $50 to $60 as the prompt squeeze intensifies and deferred futures continue pricing "eventual resolution" of a conflict that shows no signs of resolution.
The spread widens.
The Third Scenario: A Lasting Deal
What if a comprehensive deal is struck in the coming weeks? Iran stands down, the strait reopens fully, tankers resume at 100+ per day?
This is the scenario priced by the back end of the futures curve. It implies oil returns toward $70 to $80 by 2027. It is not impossible.
But even here, the spread does not immediately collapse.
Supply chain normalisation after the largest energy disruption since the 1970s takes months. Ships need to be repositioned. Insurance needs to be rewritten. Port infrastructure that has been idle or damaged needs to be assessed. Refineries that have been running on emergency reserves and redirected cargoes need to restock. Governments, including the 32 IEA member states that released 400 million barrels from strategic reserves in March, need to rebuild those reserves, adding to demand.
BCA Research's Gertken said it directly: energy and commodity markets are likely to remain on a structurally higher floor regardless of ceasefire outcome, as governments hoard and restock in anticipation of renewed conflict, keeping oil prices elevated well above pre-war levels.
In a resolution scenario, futures would rally. Physical would remain tight. The spread widens temporarily before eventually normalising.
There is no scenario in the near term where the spread simply disappears overnight.
What the Curve Is Actually Telling You
The steep backwardation structure contains a message most retail traders miss entirely.
The long end of the curve at $70 to $80 reflects US shale capacity, non-OPEC supply stability, and the market's belief that this crisis does not alter the structural oil balance permanently. That view may be correct in the long run.
But the front end at $99 to $104 reflects something different: the physical reality of 230 stranded tankers, 9.1 million barrels per day of shut-in production, sea mines in the world's most important shipping lane, and a US-Iran standoff with no diplomatic off-ramp in sight.
Large corporations with treasury operations are buying deferred futures for late 2026 delivery, locking in prices well below the spot market. Airlines, grain merchants, and manufacturers are hedging at $75 to $80 for Q4. They are paying the paper price.
Households, small businesses, and import-dependent economies are paying the physical price. In the US, regular gasoline averages $4.13 per gallon. In Asia, Dubai-linked crude trades at $138 to $140. The K-shaped energy shock is already running.
The Aivantaiq View
Our macro thesis on Hormuz has not changed since February: the strait is not reopening cleanly or quickly. The ceasefire experiment proved it. The Islamabad collapse confirmed it. The US naval blockade has now institutionalised the conflict into a new phase where both sides are locked into positions that cannot be walked back without significant concessions neither currently appears willing to make.
The structural trade remains:
Long energy names that benefit from elevated physical prices and do not depend on Gulf transit: domestic US producers (XLE, AR, EQT, KMI), LNG infrastructure plays (NFE), and pipeline operators positioned for the rerouting of global energy flows.
Hedges on rate-sensitive equity via SPY puts at multiple strikes, ASML and TSM as the downstream casualty of the helium and LNG supply chain fracture through Ras Laffan, and European industrials via OESX, all of which face stagflationary pressure from energy costs that the ECB cannot address with rate cuts alone.
Volatility via VIX DEC26 calls, priced for the possibility that this conflict has further chapters (nuclear talks collapse, Israeli escalation, IRGC asymmetric response to the blockade) that the current vol surface does not fully price.
The oil price debate is not about whether we reach $150 or $200 or $300. It is about recognising that the futures market and the physical market now operate in different universes, and that the gap between them can only close in one of two ways: futures rising to meet physical reality, or physical reality collapsing far enough to meet futures.
Given what is currently sitting in the Strait of Hormuz (a US naval blockade, Iranian sea mines, 230 stranded tankers, and two sides that just failed to agree on anything in Islamabad) decide for yourself which of those is more likely.
This is not investment advice. All content is for informational and educational purposes only. Do your own research. Aivantaiq takes no responsibility for trading decisions made on the basis of this analysis.
#IranWar #Hormuz #OilPrice #Options #Trading #XLE #MacroTrading #GeopoliticalRisk #Houthis #RedSea #EnergyTrading #OptionsTrading #Commodities #OOTT #WTI #Brent #MacroInvesting #BlackSwan #Aivantaiq
@zerohedge@markets@business@Schuldensuehner@MacroAlf@RaoulGMI@elerianm https://t.co/VVlUnpJky1
The Architecture of Dollar Dominance Is Collapsing in Real Time
Five signals the macro world is ignoring, and why traders who see it now will define this decade
There are moments in financial history when the old order does not fall. It dissolves. Not in a single dramatic crash, but through the quiet, simultaneous failure of multiple load-bearing pillars. We are in one of those moments right now.
Over the past week, five data points have emerged across the macro landscape. Taken individually, each is significant. Taken together, they form something that looks less like a stress event and more like a structural handover.
This is not another doom post. This is a map.
I. Japan Is Running Out of Time, And So Is the Treasury Market
The Japanese 10-year bond yield just touched 2.48%, its highest level since July 1997. Let that sink in. Japan's government carries debt above 200% of GDP. Every 100 basis points of sustained yield increase mechanically adds roughly 0.2% of GDP to Tokyo's annual debt-servicing bill. And approximately one-ninth of Japan's outstanding JGB stock matures every single year, needing to be refinanced at whatever rate the market demands.
This is not a bond market tantrum. This is a solvency slow-motion.
But here is the dimension the consensus is missing: Japan's last resort is to sell US Treasuries. The mechanism is textbook. Sell USTs to obtain dollars, sell dollars to buy yen, defend the currency. Tokyo has been building reserves for exactly this moment, increasing its Treasury holdings by nearly $40 billion between December 2025 and January 2026. Japan's Finance Minister has already stated publicly that the government is prepared to act "on all fronts."
If the yen breaks decisively through 160, and it is currently trading just below that threshold, the Ministry of Finance acts. When it acts, it sells US paper. When Japan sells US paper at scale, Treasury yields spike. When Treasury yields spike, the world reprices everything: equities, credit, mortgage rates, emerging market debt.
The Bank of Japan meets April 27 to 28. The clock is ticking.
There is also the yen carry trade sitting quietly in the background. Estimates put it between $260 billion and $1 trillion in notional exposure. An intervention-triggered unwind of that trade would not just move USD/JPY. It would be a simultaneous margin call across every asset class that carry-funded positions touch.
II. CIPS Just Broke Its Own Record, And Nobody in the West Is Talking About It
China's Cross-Border Interbank Payment System, the yuan-denominated SWIFT alternative, processed 1.22 trillion yuan in a single day last month. That is approximately $178 billion in 24 hours, across nearly 42,000 transactions. Average daily volumes in March 2026 hit 920 billion yuan, up nearly 50% from February.
What changed? Iran.
Since the Strait of Hormuz closure, Iranian oil has continued flowing to China, but exclusively through channels that bypass the US banking system. Project mBridge, the BRICS-adjacent digital currency settlement rail, handled over $55 billion in trade in March 2026 alone. The Dark Fleet does not just carry crude. It carries a proof-of-concept that the dollar can be routed around at meaningful scale.
The yuan still accounts for just 3% of global SWIFT payment share versus 48% for the dollar. Nobody serious is arguing for overnight replacement. But the architecture matters more than the market share at this stage. Every billion dollars settled through CIPS is another data point that the infrastructure works, and that the political will to use it is hardening.
Beijing recently completed the first major overhaul of CIPS business rules in eight years, effective February 2026, explicitly expanding toward multi-currency settlements. That is not a coincidence of timing. That is preparation.
Deutsche Bank strategists have noted in writing that the ongoing conflict "might trigger the decline of petrodollar supremacy while starting the petroyuan system." When Deutsche Bank says it in a published note, the Overton window has moved.
III. The Petrodollar Loop Is Broken, And Bloomberg Finally Said It Out Loud
Bloomberg Opinion ran a piece last week with a headline that would have been considered fringe commentary eighteen months ago: "The Petrodollar Loop Supporting the Treasury Market Is Broken."
Let me explain the mechanism for newer readers, because this is the hinge on which the entire post-Bretton Woods order swings.
Since Henry Kissinger's 1974 deal with Riyadh, the global system has operated on a simple recursive logic. Gulf states price oil in dollars. Oil importers must hold dollars. Gulf states park surplus petrodollars in US Treasuries. Washington provides security guarantees. The loop recycles dollar demand permanently into US debt financing. It is the foundational reason American consumers have borrowed cheaply for fifty years.
That loop now has multiple simultaneous breakage points.
Iran controls Hormuz and is charging transit fees, with at least two vessels reported paying in yuan rather than dollars, splitting revenue with Oman. Gulf SWFs are rotating out of US assets as their own export revenues take a hit from reduced traffic through the strait. Saudi Arabia's largest customer is now China, not the United States. Riyadh has been settling some Chinese sales in yuan since 2023, with yuan now convertible to physical gold through the Shanghai exchange, creating an oil-to-gold settlement pathway that bypasses the dollar entirely.
A non-dollar toll on the world's most critical oil chokepoint is not a rounding error. It is a direct challenge to the 1974 architecture. As the Council on Foreign Relations' Edward Fishman stated plainly this week: "When you think about the dollar as the world's dominant currency, the petrodollar is right at the heart of that."
That heart is now operating with an irregular rhythm.
The security guarantee side of the equation is equally fractured. The US failure to guarantee free navigation through the Gulf undermines the very premise on which Gulf states accepted dollar pricing. If Washington cannot protect the strait, why accept Washington's currency?
IV. The Dollar's Paradox: Strong Today, Structurally Dying
Here is the trade that confuses most people. The dollar strengthened at the start of the Iran war. The Dollar Index surged toward 99.50 as investors fled to safety. Classic crisis behavior.
But this strength is the final expression of a dying paradigm, not proof of its health. When oil spikes, importers scramble for dollars to pay for expensive crude. That is not dollar confidence. That is dollar compulsion. There is a difference between a currency that the world chooses and one that the world has no immediate alternative to. We are still living in the second category, but the gap is closing faster than the price of DXY suggests.
The second-order effects are where the dollar dies quietly.
Countries under dollar squeeze accelerate local-currency bilateral deals. Gulf states with shrinking surpluses recycle fewer petrodollars into Treasuries. Japan, forced to sell USTs to defend its currency, removes a key marginal buyer of US debt at exactly the moment the Pentagon is requesting a $200 billion supplemental war budget that will require even more Treasury issuance. The IMF's April 2026 World Economic Outlook, released this week, projects cascading growth headwinds from the Middle East conflict across every energy-importing economy. Europe has seen natural gas prices surge 39% since the war began.
The structural argument plays out over 18 to 36 months, not 18 to 36 days. Harvard economist Ken Rogoff, who literally wrote the book on dollar fragility, told Axios this week: "This is really bigger than 'Liberation Day.'"
He is right. Liberation Day was a policy shock. What is happening now is an infrastructure shock. Policy can reverse. Infrastructure rewires slowly, and then suddenly.
V. The Variable Nobody Has Priced Into Their Macro Model
Ed Dowd has been flagging something for three years that the mainstream macro community refuses to incorporate into economic models. The working-age population in the United States and United Kingdom is dying and becoming disabled at statistically anomalous rates, well outside historical actuarial baselines.
The causal debate is contested and ongoing. But the actuarial reality is no longer deniable. US insurers continue to report elevated excess mortality in the 18 to 64 cohort. The disability rolls have expanded. Labor force participation is impaired in ways that headline unemployment figures obscure. Insurance companies at board level are discussing continued excess mortality and raising long-term mortality assumptions, which will eventually run through their P&Ls as reserve adjustments.
Why does this matter in a petrodollar piece? Because the fiscal arithmetic of the United States depends on a growing, productive, insurable, tax-paying working population to service an exponentially expanding debt load. If that base is contracting, biologically rather than just economically, then the Treasury's revenue projections built on labor force growth assumptions are quietly and structurally wrong.
This is a slow variable. But slow variables, when they interact with fast-moving crisis triggers like a Hormuz closure, a JGB sell-off, a yen intervention, and a CIPS record, create non-linear outcomes that models built on historical correlations cannot anticipate. The 2008 crisis was not predicted because the models did not capture tail interactions. This is another version of that problem.
In a system already stressed across five simultaneous fault lines, the last thing the fiscal math needs is a demographic anchor pulling from beneath.
What the Framework Suggests
Aivantaiq is an intelligence service, not a trade-recommendation letter. But the framework is clear enough to state directly.
The trades that survive this environment are positioned for duration of stress, not resolution of stress. The ceasefire rumors, the Islamabad talks, the April 7 relief rally: these are noise within a signal. The signal is that the institutional plumbing of dollar dominance is being stress-tested across six simultaneous fault lines for the first time since Bretton Woods.
Energy equities remain structurally supported as long as Hormuz is constrained, not because of day-to-day price action, but because the investment case for North American energy infrastructure independence has never been more legible to institutional capital.
Deep out-of-the-money volatility is the position that pays if the market's current equanimity proves delusional. The S&P is trading near pre-war levels. That is either the most sophisticated macro discounting machine in history correctly pricing a near-term resolution, or it is the most dangerous complacency in a generation. I know which one I am positioned for.
Semiconductor supply chains remain exposed through the Qatar helium thesis developed in these pages in March. That thesis has only strengthened as regional disruption compounds. And ASML, the world's most irreplaceable chokepoint in chip manufacturing, sits in a country that imports over 80% of its energy, with European natural gas already up 39%.
The put is alive.
The Bottom Line
The dollar is not dying this quarter. It may not die dramatically in any Hollywood-crash sense this decade. But the architecture supporting its global primacy, the security guarantee, the petrodollar recycling loop, the captive Treasury buyer base, the sanctions as enforcement mechanism, is being dismantled in real time, simultaneously, by adversaries who have been planning this for a decade and allies who are quietly hedging.
When Bloomberg says the petrodollar loop is broken. When the IMF titles its flagship publication "Global Economy in the Shadow of War." When Japan's 10-year yield hits levels unseen since the Clinton administration. When CIPS breaks its own daily transaction record in the middle of a crisis that just happens to be accelerating yuan-settled oil trade.
These are not separate stories.
This is one story.
And most of the market has not read it yet.
This is not investment advice. All content is for informational and educational purposes only. Do your own research. Aivantaiq takes no responsibility for trading decisions made on the basis of this analysis.
geopolitics, macro, petrodollar, dollar, Iran, Hormuz, oil, energy, Japan, JGB, yuan, CIPS, dedollarization, options, trading, BlackSwan, Aivantaiq
#IranWar #Hormuz #OilPrice #Options #Trading #XLE #MacroTrading #GeopoliticalRisk #Houthis #RedSea #EnergyTrading #OptionsTrading #Commodities #OOTT #WTI #Brent #MacroInvesting #BlackSwan #Aivantaiq
@zerohedge@markets@business@Schuldensuehner@MacroAlf@RaoulGMI@elerianm
https://t.co/XU22ZOzdCz
China Turned Off the Tap. The Molecule No One Talks About (For Dummies)
Aivantaiq Intelligence | April 2026
While Trump announced the Hormuz blockade in all caps on Truth Social, Beijing made a different kind of move. Quiet. Bureaucratic. Devastating.
Thanks for reading! Subscribe for free to receive new posts and support my work.
On April 10, China suspended all sulfuric acid exports effective May 2026.
You have never heard of this. That is the point.
What Is Sulfuric Acid
It is the most widely produced industrial chemical on earth. More sulfuric acid is manufactured each year than almost any other substance in industrial history.
Here is what stops working without it.
Food. Phosphate fertilizers require sulfuric acid to process. No acid, no fertilizer. No fertilizer, lower crop yields. This is not theoretical. This is chemistry.
Copper. The mining method used to extract copper from low grade ore is called heap leaching. It requires massive quantities of sulfuric acid. No acid, no copper. No copper, no electrical cables. No cables, no energy infrastructure, no data centers, no grid expansion, no energy transition.
Batteries. Sulfuric acid is the electrolyte in lead acid batteries and a processing input in lithium refining. The electric vehicle supply chain runs through this molecule.
Petroleum. Refineries use sulfuric acid to process crude into usable fuel. It is embedded in the system before a single barrel reaches a pump.
Textiles. Acid treatment is standard in fiber processing. Clothing. Industrial fabric. All of it.
One molecule. Invisible to the public. Central to everything industrial civilization produces.
The Double Squeeze
This is where the trade thesis lives.
The world gets its sulfuric acid from two sources. Raw sulfur, which is processed into acid. And finished acid exported directly from China.
Both are now being cut simultaneously.
Front one. The Strait of Hormuz closure has strangled sulfur exports from the Middle East. That region produces roughly a third of global sulfur supply. Since February 28, tanker traffic through Hormuz has collapsed. The raw material for acid production is drying up.
Front two. China just shut off its finished acid exports. China is the largest exporter of sulfuric acid on the planet. The ban starts in May.
The result is a simultaneous supply shock on the raw material and the finished product. Both inputs. Both gone. At the same time.
Sulfur prices have already surged 70% since the start of the conflict. Sulfuric acid prices in Chile rose 44% in a single month.
A CRU analyst stated it plainly. The loss of Chinese volumes will be hard to compensate for given the parallel shortage of sulfur raw materials.
Why Chile Is Ground Zero
Chile is the world’s largest copper producer. It is also one of the largest importers of Chinese sulfuric acid on earth. Over a million tons per year.
Approximately 20% of Chilean copper output depends on heap leach processing. Heap leach runs on sulfuric acid.
Less acid in Chile means less copper on the global market. Less copper means rising costs for every electrical system built anywhere in the world. Infrastructure. Data centers. Grid upgrades. Defense hardware. All of it.
The Democratic Republic of Congo and Zambia face the same pressure on copper. Indonesia faces it on nickel. These are not peripheral markets. These are the backbone of the global battery and electrification supply chain.
What This Tells You About Chinese Strategy
Beijing does not need to declare war. It needs to identify leverage and apply it.
This is the doctrine China has been executing for fifteen years. Locate the invisible dependency. Build dominant market position. Wait for maximum geopolitical tension. Then turn off the tap.
The precedents are long. Rare earth exports to Japan in 2010. Gallium and germanium restrictions in 2023. Graphite controls the same year. Every time the method is identical. Find the molecule, the metal, the material that sits underneath everything else and that the world forgot to worry about. Become indispensable. Then act.
Trump announces a naval blockade in capital letters. China files a regulatory notice with its producers.
One plays theater. The other plays chess.
The Cascades You Are Not Pricing
The mainstream market is watching oil at $104 and the naval confrontation in the strait. That is the visible crisis.
The invisible crisis is this.
Copper production constraints in the second half of 2026 as Chilean and African miners exhaust acid inventories. Fertilizer price spikes into the northern hemisphere planting season. Refinery margin compression as acid availability tightens. Battery supply chain delays as lithium processing costs rise.
These effects do not show up in headlines today. They show up in earnings guidance in Q3. They show up in food price indices in Q4. They show up in analyst downgrades that everyone will describe as sudden but none of which are.
The war no one talks about is often the most effective.
The Positions That Follow
Copper miners with acid dependent operations face a direct margin squeeze. FCX and SCCO carry the most exposure. Chilean operations are the most acute pressure point.
Fertilizer producers face input cost escalation at precisely the moment food security concerns are already elevated. MOS and NTR are exposed on both sides of that equation.
Agricultural commodity ETFs like DBA capture the downstream food price pressure that acid scarcity feeds into over a two to three quarter lag.
The thesis is simple. The market is watching the blockade. The blockade is the distraction. The molecule is the weapon. And the weapon has already been deployed.
This is not investment advice. All content is for informational and educational purposes only. Do your own research. Aivantaiq takes no responsibility for trading decisions made on the basis of this analysis.
Aivantaiq publishes geopolitical intelligence and macro analysis for traders and serious investors. Follow on X @aivantaiq1.
#IranWar #Hormuz #OilPrice #Options #Trading #XLE #MacroTrading #GeopoliticalRisk #Houthis #RedSea #EnergyTrading #OptionsTrading #Commodities #OOTT #WTI #Brent #MacroInvesting #BlackSwan #Aivantaiq
@zerohedge@markets@business@Schuldensuehner@MacroAlf@RaoulGMI@elerianm
The last tanker
Your summer flight is now a geopolitical event. Here is what happens next.
Today the last ship carrying jet fuel from the Persian Gulf docks in Rotterdam. After this point, unless the Strait of Hormuz reopens, there is no more supply coming from the region that has powered European and Asian aviation for decades. What this means for your flight, your fare, and your summer plans is not a future scenario. It is already happening.
Thanks for reading! Subscribe for free to receive new posts and support my work.
+95%
Jet fuel price since Feb 28 strikes on Iran
7,049
Flights cancelled in a single day in early April
$150
Fuel surcharge now appearing on some tickets
The price shock came first when the United States and Israel struck Iran on February 28, jet fuel was trading at $2.50 a gallon in the United States. By April 2 it had reached $4.88. That is a near doubling in five weeks. In Europe and Asia, where dependency on Gulf supply is deeper, the increases were sharper still. The IEA has confirmed jet fuel prices rose 95 percent globally across that period.
Airlines cannot absorb that. Fuel typically accounts for 20 to 30 percent of an airline’s operating costs in normal conditions. At these prices it is the single largest line on the balance sheet, and it is moving every day. United Airlines CEO Scott Kirby told employees the current fuel costs would require an additional $11 billion in annual expense for jet fuel alone. That figure is more than double United’s best ever annual profit of $5 billion.
The price shock was manageable as long as it was only a price shock. The problem is that it stopped being only a price shock around the time the last tanker left Kuwait.
Now it is an availability crisis
Price and availability are different problems with different solutions. A price problem means airlines raise fares, add surcharges and cut unprofitable routes. An availability problem means airlines cannot physically get the fuel they need, regardless of what they are willing to pay.
Europe is about to move from the first problem to the second. Roughly half of EU and UK jet fuel imports come from the Persian Gulf. That supply is now cut off. Refineries in Europe will increase production. The US will redirect exports. But neither source can substitute Gulf volumes at scale quickly enough. The maritime logistics alone take weeks. Europe’s own refining capacity has been declining for years.
The buffer runs out in late April. Storage at the Amsterdam, Rotterdam and Antwerp hub, Europe’s largest oil trading centre, is already below seasonal levels. Forecasts suggest only half the required kerosene volumes will be available across Europe by the start of May.
Which flights disappear first
The order in which flights get cut follows a clear logic. The most fuel intensive routes go first because they are the most expensive to operate and the hardest to replace with alternative supply at the destination airport.
Long haul routes of 11 to 13 hours are the first casualties. Your direct flight to Bangkok, Singapore, Tokyo or New York is more exposed than the short haul budget route from London to Malaga. That may feel counterintuitive but the economics are simple. A 12 hour flight burns many times the fuel of a 2 hour flight. When fuel is rationed at the destination airport, the aircraft that arrives needing the most fuel for the return leg is the first to be turned away or cancelled.
After long haul comes the off peak domestic and regional schedule. United is already cutting midweek and red eye services. Ryanair CEO Michael O’Leary has warned that airlines will have little advance notice of which flights they must cancel in May and June. The decision will depend entirely on how much fuel each airport has left in its tanks at the moment of departure.
“We will then look around and we will be trying to ground one or two aircraft and minimise the inconvenience for customers.” Ryanair CEO Michael O’Leary
That is not a reassuring sentence from the man who runs Europe’s largest airline by passenger numbers.
What the carriers are actually doing
United Airlines
5% route cuts Q2 and Q3
First major US carrier to formally reduce schedule. Preparing for oil above $100 through 2027.
Lufthansa
Up to 40 aircraft grounded
CEO briefed staff on two scenarios: 20 aircraft cut or 40 aircraft grounded depending on conditions.
Air New Zealand
1,100 flights cut through May
5% of total network removed. Pacific routes most affected.
SAS
1,000 flights cancelled in April
Scandinavian routes and European connections most exposed.
Vietnam Airlines
Up to 20% of all flights
Seven domestic routes suspended. Gulf dependency leaves Asian carriers most exposed.
Ryanair
5 to 10% warning for summer
CEO says UK most vulnerable in Europe due to Kuwaiti market share in fuel supply.
Delta has logged a $400 million charge. Cathay Pacific raised fuel surcharges by 34 percent from April 1. Thai Airways flagged fare increases of 10 to 15 percent. Air France KLM is drawing up contingency scenarios. The pattern is the same across every major carrier: capacity is shrinking, fares are rising, and the decisions being made now will define what summer travel looks like.
What this means if you have a flight booked
The honest answer is that it depends on when you are flying, where you are going, and which airline you are using.
Flights before late April are likely to operate as booked. The buffer still exists. April is uncomfortable but not yet critical. The risk window opens in May and widens through June and July if the Strait remains closed. Long haul routes to Asia are the highest risk category right now. Budget short haul within Europe is more resilient but not immune, particularly at airports that rely heavily on Gulf sourced fuel like those in the UK.
Fares are going up regardless of whether your specific flight gets cut. Airlines are raising prices across the board to offset costs. Baggage fees are rising too. JetBlue already increased checked bag fees citing rising operating costs. United’s fee for the first checked bag rose by $10. These decisions move in one direction and they do not reverse when oil prices ease.
Even if the Strait reopens tomorrow, the problem does not end quickly. Airlines warn it could take months for shortages to ease because Middle East refining capacity has been disrupted, not just the shipping lanes. Production has been taken offline. Storage in the region has run low. The supply chain does not simply restart when a strait reopens.
The consumer reality for summer 2026
Half of Americans had planned to travel this summer and expected to spend $4,000 more than last year, according to research conducted before the Iran war began. Those numbers are now being reassessed in real time. Travel demand has not collapsed but the cost of acting on that demand is rising sharply.
Airfares on international and regional routes have already surged between 30 and 40 percent according to industry data. Add fuel surcharges of up to $150 per ticket and the summer trip that was budgeted in January looks very different in April.
For travellers the practical advice is simple. Book long haul flights now if you intend to take them. Flexibility matters more than it has at any point since 2020. Check whether your travel insurance covers cancellations caused by fuel shortages specifically. Many standard policies do not.
The summer of 2026 will not be grounded. But it will cost more, connect less, and for a meaningful share of passengers, it will not happen at all.
This is not a temporary disruption with a known end date. It is a structural rupture in the energy supply chain that sits beneath global aviation. The Strait of Hormuz powered the world’s airports for decades. Its effective closure is not a news story. It is a new operating environment.
Stay ahead.
Aivantaiq · Energy and Geopolitics · https://t.co/nbCmti5ROz
https://t.co/zF4xCup4HA
@zerohedge@markets@business@Schuldensuehner@MacroAlf@RaoulGMI@elerianm
#IranWar #Hormuz #OilPrice #Aviation #JetFuel #Travel #Airlines #XLE #MacroTrading #GeopoliticalRisk #RedSea #EnergyTrading #OptionsTrading #Commodities #OOTT #WTI #Brent #MacroInvesting #BlackSwan #Aivantaiq
Thanks for reading! Subscribe for free to receive new posts and support my work.
I Bought Energy Calls at $0.63 Before the Iran War.
Here’s My Book.
One tanker. 180 stranded. European jet fuel ends today. The ceasefire is theatre.
40 days into Operation Epic Fury. Hormuz still closed. Ceasefire already cracking. The market thinks this ends in weeks. I think it lasts the year. Here is every position, every loss, every conviction and why I am holding.
The Thesis in One Sentence
The Strait of Hormuz will remain effectively closed for the entirety of 2026, oil will hit $150 and above, the US equity market will fall 35 to 40%, and every options position I own was built for exactly this scenario starting in February, before the first bomb dropped.
The market disagrees. Kalshi prices a 2026 recession at 28%. Polymarket says Hormuz normalises by July at 76%. I say both are wrong. That gap between what the market believes and what I believe is where the profit lives.
The Timeline: How We Got Here
January 2026. Thesis formed. Iranian protests, US military buildup, nuclear talks collapsing. Begin building options book.
February 28. Operation Epic Fury begins. US-Israel strikes on Iran. Khamenei killed. Hormuz closed. XLE 80C already in book at $0.63.
March 18. Ras Laffan struck. Qatar helium offline. Helium and semiconductor thesis confirmed. Book peaks at +604 CHF / +26.51%.
March 23. Fake ceasefire. Trump tweets deal. Oil drops $12. Book bleeds. Iran denies within 6 hours. Oil recovers.
April 2. Liberation Day tariffs. Simultaneous supply shock and trade war. Book at -509 CHF. Added VIX 200C x10 at $0.22.
April 3. US troops enter Iran. F-15 crew rescued after heavy fighting. First confirmed ground incursion. Polymarket: troops by December = 100%.
April 8. Ceasefire announced. Two week truce. Vance to Islamabad. Oil drops 13%. Book crashes to -1,206 CHF. One tanker per day through Hormuz vs 110 needed.
April 10. Today. European jet fuel supply ends. 180 tankers with 172 million barrels stranded in Gulf. Added AAL $8P x5. Book: -1,206 CHF / -40.87%.
The Current Book
Position | Qty | Cost | P&L | Status
------------------|-----|-------|------|------------
XLE JAN27 80C | 4 | $0.63 | +22% | ✅ WORKING
ZIM JAN27 39.16C | 15 | $0.05 |+8.7% | ✅ WORKING
NFE JAN27 25C | 7 | $0.05 | +31% | ✅ RECOVERING
AAL JAN27 8P | 5 | $0.67 | NEW | 🆕 NEW TODAY
VIX DEC26 200C | 10 | $0.22 | -37% | ⏳ LOADING
SPY JAN27 300P | 1 | $2.18 | -30% | ⏳ LOADING
SPY JAN27 285P | 1 | $2.05 | -35% | ⏳ LOADING
ASML JAN27 340P | 1 | $4.20 | -37% | ⏳ LOADING
AMZN JAN27 125P | 1 | $2.62 | -37% | ⏳ LOADING
AR JAN27 55C | 1 | $2.60 | -28% | ⏳ LOADING
KMI JAN27 45C | 4 | $0.47 | -44% | 🔴 PAIN
EQT JAN27 95C | 1 | $3.00 | -62% | 🔴 PAIN
Total book: -1,206 CHF / -40.87%. Peak: +604 CHF. Expected value: +$38,596.
Why the Ceasefire Changes Nothing
On April 8 Trump announced a two week ceasefire. Markets surged. Oil dropped 13%. My book lost another 10 percentage points in a day. Here is why I did not sell a single contract.
The ceasefire is not a reopening of Hormuz. In 24 hours, one oil tanker transited the strait. The baseline is 110 per day. 180 tankers carrying 172 million barrels remain stranded inside the Gulf. ADNOC CEO Sultan Al Jaber said today the strait “is not open.”
The last jet fuel tanker from the Persian Gulf arrived at Rotterdam this morning. After that, European supply stops. The Financial Times reports jet fuel shortages at European airports within three weeks. Alexander Stahel called it “a 100% predictable outcome with no solution at this point.”
Futures say oil is $97. Brent spot cargo is trading at $141. That $44 spread is the largest in history. The paper market is being moved by Trump tweets. The physical market is telling you the truth.
Historical Ceasefire Base Rates
Of the last 10 major conflict ceasefires where core issues remained unresolved including Bosnia, Gaza, Libya, Ukraine Minsk, Lebanon 2006- nine out of ten collapsed. The one that held was the Iran-Iraq ceasefire in 1988, after 8 years of war and both sides completely exhausted.
We are on day 40. Iran’s 10 demands and the US position are irreconcilable. Iran wants permanent Hormuz control. The US will never accept that. Iran wants uranium enrichment. Trump explicitly said no enrichment ever.
My probability that this ceasefire holds permanently: 5 to 10%. Polymarket says 34% ceasefire ends by April 21. History says 90%.
The Profit Scenarios
Scenario | Probability | Book Profit
----------------------------------|-------------|------------
Permanent peace deal | 10% | -$2,500
Ceasefire extends, slow burn | 36% | +$8,000
Ceasefire collapses by April 21 | 34% | +$45,000
Full war resumes and recession | 15% | +$130,000
🚨 Black swan: VIX 80, oil $200 | 5% | +$500,000
Total expected value: +$38,596. Against a current book of -1,206 CHF. The negative P&L today is not a thesis failure. It is the cost of being early.
The Michael Burry Parallel
In 2007, Michael Burry’s fund lost 18% while betting against mortgage backed securities. His investors tried to pull their money. He held. By 2008 he was up 489%.
The structure is identical. A macro thesis priced by the market at 5 to 10% probability. A portfolio sitting in drawdown. The thesis getting more confirmed by the day. Ground troops in Iran. Hormuz still closed. IEA calling this the worst energy crisis in history. While the market keeps pricing a return to normality that is not coming.
As Fatih Birol, IEA Executive Director said on April 1: “Today we lost 12 million barrels per day, more than two of the 1970s oil crises put together. The cure is opening up the Strait of Hormuz.”
New Position: AAL Jet Fuel Puts
Added today: 5 x AAL JAN27 $8P at $0.67. The thesis is simple. American Airlines spends 30% of its operating budget on jet fuel. The last Gulf jet fuel tanker arrived in Rotterdam this morning. European airports face shortages in three weeks per the FT. Airlines have no hedging beyond 6 months at $150 and above per barrel oil.
AAL at $11.37. Needs to fall 30% to $8 to activate. At sustained $150 oil, AAL goes to $4 to $5. That $8P pays out $300 to $400 per contract on a $67 investment.
What I Am Watching
Three metrics matter above all else this week.
First, Islamabad talks running today through Saturday. Vance leads the US delegation. If talks collapse, oil spikes, VIX spikes, entire book recovers simultaneously.
Second, Kalshi recession odds. Currently 28%. When they cross 40%, triggered by Q1 GDP data on April 30, SPY puts reprice 3 to 5x overnight.
Third, Hormuz tanker count. Follow @HormuzLetter on X. When it says 10 or more tankers per day, the ceasefire is real. When it says 1 to 2 per day, thesis confirmed and book recovers.
The single most important number: Kalshi recession odds at 28%. Moody’s AI model at 49%. My thesis: 95%. The moment Kalshi crosses 50%, SPY 300P goes from -30% to +200%. That trigger is April 30 GDP data. 21 days.
Conclusion: Hold Everything
The book is down 40.87%. The thesis is more confirmed than it was when I entered. One oil tanker through Hormuz in 24 hours. European jet fuel ending today. Ground troops in Iran confirmed. Polymarket now 100% on US troops in Iran by December.
The market is wrong. It was wrong in February. It is wrong now. It will be wrong in April and May. And when it stops being wrong — when the ceasefire collapses and Hormuz remains closed and Q1 GDP comes in negative — every position in this book reprices simultaneously.
Expected value: +$38,596. Probability of profit: 65%. Time remaining on all positions: 9 months.
Stay ahead.
Aivantaiq. https://t.co/uauvGexg76
This is not financial advice. All options trading involves substantial risk of loss. Options can expire worthless. Never invest more than you can afford to lose completely.
#IranWar #Hormuz #OilPrice #Options #Trading #XLE #MacroTrading #GeopoliticalRisk #EnergyTrading #OptionsTrading #Commodities #OOTT #WTI #Brent #MacroInvesting #BlackSwan #Aivantaiq
@zerohedge@markets@business@Schuldensuehner@MacroAlf@RaoulGMI@elerianm
“Called it three days ago and I was dead right.
The ceasefire I said was already structurally dead? It’s fracturing exactly as I predicted.
Hormuz traffic? Still near zero (one tanker in 24h vs 110+ normal). European jet fuel supply is now officially ending. Lebanon dispute? Still a total binary mess with zero enforcement.
History’s 80%+ failure rate wasn’t a guess it’s playing out in real time while markets price in fairy-tale resolution.
Told you the base case is collapse/escalation. Positioned accordingly.
#IranWar #Hormuz #OilPrice #GeopoliticalRisk #MacroTrading #EnergyTrading #OOTT #WTI #Brent
@zerohedge@markets@business@Schuldensuehner@MacroAlf@RaoulGMI@elerianm
The Ceasefire Is Already Dead. Here Is What Happens to Markets Next.
Thirteen days. That is the median time before a ceasefire collapses into renewed fighting. This one is not going to last thirteen days. The US brokered Iran ceasefire is already fracturing over one binary disagreement: Israel says Lebanon is not covered. Iran, Hezbollah, France, Egypt, and Pakistan say it is. That is not an implementation dispute. That is two sides describing different agreements. Here is what history says happens next, and exactly what it means for your portfolio.
The Number Nobody On Wall Street Is Looking At
Political scientist Virginia Fortnas landmark research: 80 percent of ceasefires fail outright. A study of 105 collapsed agreements across 25 wars from 1947 to 2016 found the median time to renewed fighting is thirteen days.
In the Arab Israeli and Iran proxy theater the record is worse. The 1949 armistices, the 1973 war truce, the 1988 Iran Iraq agreement, every major Gaza Lebanon deal since 2006. All collapsed. The 2006 Lebanon ceasefire accumulated over ten thousand violations within two years.
Equity markets are pricing a diplomatic resolution. History says that is the minority outcome. The base case is collapse. The market is wrong.
The Financial Cascade Nobody Is Modeling
This is where it gets serious.
Stage one is the oil shock. Hormuz disruption removes roughly 20 percent of global seaborne oil supply simultaneously. WTI and Brent reprice within hours. The 1973 embargo took months to bite. A kinetic Hormuz closure is instantaneous.
Stage two is the LNG contagion. Qatars Ras Laffan complex, the worlds single largest LNG and helium export facility, sits 150 kilometers from Iranian territorial waters. Offline or operating under active threat, it removes the marginal supplier for European and East Asian spot markets. Germany, Japan, South Korea face an energy input shock with no short term substitute. Industrial output contracts. Inflation reaccelerates in economies central banks had only just stabilised.
Stage three is equity repricing. Risk off hits the obvious names first. Then the second order move lands harder. ASML, TSMC, Samsung, SK Hynix all carry material helium supply chain exposure routed through Qatar. Semiconductor fabrication does not stop immediately but forward guidance collapses and multiples compress fast. The AI infrastructure buildout, currently priced for uninterrupted execution, takes a direct hit.
Stage four is the dollar paradox. Initial safe haven flows strengthen the dollar. Then the medium term dynamic inverts. Gulf sovereign wealth funds slow their recycling of petrodollar surpluses into US Treasuries. Chinese yuan invoicing for oil purchases accelerates as Beijing positions itself as the stable alternative clearing currency. The marginal buyer of US debt steps back precisely when US fiscal borrowing needs are highest.
Stage five is reserve erosion. Not a 2026 event. A 2027 to 2030 structural shift. But the catalyst that triggers it is a sustained Middle East conflict that makes dollar dependence look like a geopolitical liability to every non Western sovereign holding US paper.
The market is not pricing any of this. It should be.
Why This Truce Has Every Failure Marker
No enforcement architecture. No UN peacekeepers, no automatic sanctions snapback, no demilitarized buffer zones on Israels northern border.
Unresolved core grievances. Hezbollahs precision missile arsenal, Irans nuclear program, sanctions pressure, Tehrans regional dominance architecture. All untouched.
Competing security dilemmas. Israel reads any pause as an Iranian rearmament window. Iran reads continued Israeli operations in Lebanon as proof the truce is fiction.
Domestic incentives for defection. Hardliners in Netanyahus coalition and the IRGC both derive institutional power from sustained tension. Neither has a stake in enforcement.
Every documented failure condition. Ticked.
What History Says Happens Next
Rapid collapse into direct escalation: 50 to 60 percent probability within days to four weeks. The Lebanon dispute is the trigger.
Fragile violated truce with endemic proxy skirmishing: 25 to 35 percent probability, one to twelve months. The Lebanon 2006 to present pattern. Negative peace that bleeds indefinitely.
Medium term de escalation with tactical diplomacy: 10 to 15 percent probability. Back channel talks, partial sanctions relief, both sides quietly rearming. The JCPOA era playbook.
Comprehensive political settlement: under 10 percent probability without a fundamentally different negotiating architecture.
The base case is collapse or endless managed violence. Plan accordingly.
The Only Thing That Has Ever Actually Worked
Israel has achieved durable peace exactly three times. Each time the formula was identical.
Egypt 1979. Sinai returned, full diplomatic recognition, US economic support, demilitarized zones, security cooperation. Forty five years later it holds.
Jordan 1994. Treaty plus water rights and economic normalization. Still intact.
Abraham Accords 2020. Economic integration turned adversaries into partners. Financial incentives did what security guarantees alone never could.
None of these were ceasefires. They were comprehensive political settlements that made continued conflict more expensive than peace for every party at the table.
What a Real Deal Would Require
Full treaty scope covering Lebanon and Gaza explicitly, with verifiable Hezbollah disarmament timelines and Iranian nuclear freeze under IAEA anytime anywhere inspections.
Third party enforcement with teeth. Multinational monitoring force, US plus China plus Arab states, with automatic sanctions reimposition and pre authorized military response triggers on violations. Fortnas data shows this doubles durability.
Economic normalization. Phased sanctions reduction tied to proxy reductions. An Abraham Accords style regional economic zone that makes war financially irrational for Tehran.
Saudi, UAE, and Egyptian integration into a new regional security architecture with Israel as a core participant. Peace holds when former adversaries become trading partners.
None of this happens in a two week window. None of it is close to happening now.
The Bottom Line
The ceasefire was structurally dead before it was signed. The Lebanon fracture is the immediate trigger. The absence of any enforcement mechanism, economic incentive, or political roadmap is the deeper failure.
The Hormuz risk premium is being systematically underpriced. The financial tail is not in the market. The historical base case is not resolution. It is managed escalation with periodic spikes until something breaks.
The question is not whether this truce holds. The question is whether you are positioned for the outcome history says is most likely.
Are you?
Sources: Virginia Fortna (Peace Time 2004, Does Peacekeeping Work 2008), Quinn and Joshi ceasefire durability studies, Uppsala Conflict Data Program, IEA Strait of Hormuz transit data, primary records of Arab Israeli wars, Iran Iraq war, and Abraham Accords. Standard Aivantaiq tags:
@zerohedge@markets@business@Schuldensuehner@MacroAlf@RaoulGMI@elerianm
https://t.co/5YFtaffaTq . .
The last tanker
Your summer flight is now a geopolitical event. Here is what happens next.
Today the last ship carrying jet fuel from the Persian Gulf docks in Rotterdam. After this point, unless the Strait of Hormuz reopens, there is no more supply coming from the region that has powered European and Asian aviation for decades. What this means for your flight, your fare, and your summer plans is not a future scenario. It is already happening.
Thanks for reading! Subscribe for free to receive new posts and support my work.
+95%
Jet fuel price since Feb 28 strikes on Iran
7,049
Flights cancelled in a single day in early April
$150
Fuel surcharge now appearing on some tickets
The price shock came first when the United States and Israel struck Iran on February 28, jet fuel was trading at $2.50 a gallon in the United States. By April 2 it had reached $4.88. That is a near doubling in five weeks. In Europe and Asia, where dependency on Gulf supply is deeper, the increases were sharper still. The IEA has confirmed jet fuel prices rose 95 percent globally across that period.
Airlines cannot absorb that. Fuel typically accounts for 20 to 30 percent of an airline’s operating costs in normal conditions. At these prices it is the single largest line on the balance sheet, and it is moving every day. United Airlines CEO Scott Kirby told employees the current fuel costs would require an additional $11 billion in annual expense for jet fuel alone. That figure is more than double United’s best ever annual profit of $5 billion.
The price shock was manageable as long as it was only a price shock. The problem is that it stopped being only a price shock around the time the last tanker left Kuwait.
Now it is an availability crisis
Price and availability are different problems with different solutions. A price problem means airlines raise fares, add surcharges and cut unprofitable routes. An availability problem means airlines cannot physically get the fuel they need, regardless of what they are willing to pay.
Europe is about to move from the first problem to the second. Roughly half of EU and UK jet fuel imports come from the Persian Gulf. That supply is now cut off. Refineries in Europe will increase production. The US will redirect exports. But neither source can substitute Gulf volumes at scale quickly enough. The maritime logistics alone take weeks. Europe’s own refining capacity has been declining for years.
The buffer runs out in late April. Storage at the Amsterdam, Rotterdam and Antwerp hub, Europe’s largest oil trading centre, is already below seasonal levels. Forecasts suggest only half the required kerosene volumes will be available across Europe by the start of May.
Which flights disappear first
The order in which flights get cut follows a clear logic. The most fuel intensive routes go first because they are the most expensive to operate and the hardest to replace with alternative supply at the destination airport.
Long haul routes of 11 to 13 hours are the first casualties. Your direct flight to Bangkok, Singapore, Tokyo or New York is more exposed than the short haul budget route from London to Malaga. That may feel counterintuitive but the economics are simple. A 12 hour flight burns many times the fuel of a 2 hour flight. When fuel is rationed at the destination airport, the aircraft that arrives needing the most fuel for the return leg is the first to be turned away or cancelled.
After long haul comes the off peak domestic and regional schedule. United is already cutting midweek and red eye services. Ryanair CEO Michael O’Leary has warned that airlines will have little advance notice of which flights they must cancel in May and June. The decision will depend entirely on how much fuel each airport has left in its tanks at the moment of departure.
“We will then look around and we will be trying to ground one or two aircraft and minimise the inconvenience for customers.” Ryanair CEO Michael O’Leary
That is not a reassuring sentence from the man who runs Europe’s largest airline by passenger numbers.
What the carriers are actually doing
United Airlines
5% route cuts Q2 and Q3
First major US carrier to formally reduce schedule. Preparing for oil above $100 through 2027.
Lufthansa
Up to 40 aircraft grounded
CEO briefed staff on two scenarios: 20 aircraft cut or 40 aircraft grounded depending on conditions.
Air New Zealand
1,100 flights cut through May
5% of total network removed. Pacific routes most affected.
SAS
1,000 flights cancelled in April
Scandinavian routes and European connections most exposed.
Vietnam Airlines
Up to 20% of all flights
Seven domestic routes suspended. Gulf dependency leaves Asian carriers most exposed.
Ryanair
5 to 10% warning for summer
CEO says UK most vulnerable in Europe due to Kuwaiti market share in fuel supply.
Delta has logged a $400 million charge. Cathay Pacific raised fuel surcharges by 34 percent from April 1. Thai Airways flagged fare increases of 10 to 15 percent. Air France KLM is drawing up contingency scenarios. The pattern is the same across every major carrier: capacity is shrinking, fares are rising, and the decisions being made now will define what summer travel looks like.
What this means if you have a flight booked
The honest answer is that it depends on when you are flying, where you are going, and which airline you are using.
Flights before late April are likely to operate as booked. The buffer still exists. April is uncomfortable but not yet critical. The risk window opens in May and widens through June and July if the Strait remains closed. Long haul routes to Asia are the highest risk category right now. Budget short haul within Europe is more resilient but not immune, particularly at airports that rely heavily on Gulf sourced fuel like those in the UK.
Fares are going up regardless of whether your specific flight gets cut. Airlines are raising prices across the board to offset costs. Baggage fees are rising too. JetBlue already increased checked bag fees citing rising operating costs. United’s fee for the first checked bag rose by $10. These decisions move in one direction and they do not reverse when oil prices ease.
Even if the Strait reopens tomorrow, the problem does not end quickly. Airlines warn it could take months for shortages to ease because Middle East refining capacity has been disrupted, not just the shipping lanes. Production has been taken offline. Storage in the region has run low. The supply chain does not simply restart when a strait reopens.
The consumer reality for summer 2026
Half of Americans had planned to travel this summer and expected to spend $4,000 more than last year, according to research conducted before the Iran war began. Those numbers are now being reassessed in real time. Travel demand has not collapsed but the cost of acting on that demand is rising sharply.
Airfares on international and regional routes have already surged between 30 and 40 percent according to industry data. Add fuel surcharges of up to $150 per ticket and the summer trip that was budgeted in January looks very different in April.
For travellers the practical advice is simple. Book long haul flights now if you intend to take them. Flexibility matters more than it has at any point since 2020. Check whether your travel insurance covers cancellations caused by fuel shortages specifically. Many standard policies do not.
The summer of 2026 will not be grounded. But it will cost more, connect less, and for a meaningful share of passengers, it will not happen at all.
This is not a temporary disruption with a known end date. It is a structural rupture in the energy supply chain that sits beneath global aviation. The Strait of Hormuz powered the world’s airports for decades. Its effective closure is not a news story. It is a new operating environment.
Stay ahead.
Aivantaiq · Energy and Geopolitics · https://t.co/nbCmti5ROz
https://t.co/zF4xCup4HA
@zerohedge@markets@business@Schuldensuehner@MacroAlf@RaoulGMI@elerianm
#IranWar #Hormuz #OilPrice #Aviation #JetFuel #Travel #Airlines #XLE #MacroTrading #GeopoliticalRisk #RedSea #EnergyTrading #OptionsTrading #Commodities #OOTT #WTI #Brent #MacroInvesting #BlackSwan #Aivantaiq
Thanks for reading! Subscribe for free to receive new posts and support my work.
I Bought Energy Calls at $0.63 Before the Iran War.
Here’s My Book.
One tanker. 180 stranded. European jet fuel ends today. The ceasefire is theatre.
40 days into Operation Epic Fury. Hormuz still closed. Ceasefire already cracking. The market thinks this ends in weeks. I think it lasts the year. Here is every position, every loss, every conviction and why I am holding.
The Thesis in One Sentence
The Strait of Hormuz will remain effectively closed for the entirety of 2026, oil will hit $150 and above, the US equity market will fall 35 to 40%, and every options position I own was built for exactly this scenario starting in February, before the first bomb dropped.
The market disagrees. Kalshi prices a 2026 recession at 28%. Polymarket says Hormuz normalises by July at 76%. I say both are wrong. That gap between what the market believes and what I believe is where the profit lives.
The Timeline: How We Got Here
January 2026. Thesis formed. Iranian protests, US military buildup, nuclear talks collapsing. Begin building options book.
February 28. Operation Epic Fury begins. US-Israel strikes on Iran. Khamenei killed. Hormuz closed. XLE 80C already in book at $0.63.
March 18. Ras Laffan struck. Qatar helium offline. Helium and semiconductor thesis confirmed. Book peaks at +604 CHF / +26.51%.
March 23. Fake ceasefire. Trump tweets deal. Oil drops $12. Book bleeds. Iran denies within 6 hours. Oil recovers.
April 2. Liberation Day tariffs. Simultaneous supply shock and trade war. Book at -509 CHF. Added VIX 200C x10 at $0.22.
April 3. US troops enter Iran. F-15 crew rescued after heavy fighting. First confirmed ground incursion. Polymarket: troops by December = 100%.
April 8. Ceasefire announced. Two week truce. Vance to Islamabad. Oil drops 13%. Book crashes to -1,206 CHF. One tanker per day through Hormuz vs 110 needed.
April 10. Today. European jet fuel supply ends. 180 tankers with 172 million barrels stranded in Gulf. Added AAL $8P x5. Book: -1,206 CHF / -40.87%.
The Current Book
Position | Qty | Cost | P&L | Status
------------------|-----|-------|------|------------
XLE JAN27 80C | 4 | $0.63 | +22% | ✅ WORKING
ZIM JAN27 39.16C | 15 | $0.05 |+8.7% | ✅ WORKING
NFE JAN27 25C | 7 | $0.05 | +31% | ✅ RECOVERING
AAL JAN27 8P | 5 | $0.67 | NEW | 🆕 NEW TODAY
VIX DEC26 200C | 10 | $0.22 | -37% | ⏳ LOADING
SPY JAN27 300P | 1 | $2.18 | -30% | ⏳ LOADING
SPY JAN27 285P | 1 | $2.05 | -35% | ⏳ LOADING
ASML JAN27 340P | 1 | $4.20 | -37% | ⏳ LOADING
AMZN JAN27 125P | 1 | $2.62 | -37% | ⏳ LOADING
AR JAN27 55C | 1 | $2.60 | -28% | ⏳ LOADING
KMI JAN27 45C | 4 | $0.47 | -44% | 🔴 PAIN
EQT JAN27 95C | 1 | $3.00 | -62% | 🔴 PAIN
Total book: -1,206 CHF / -40.87%. Peak: +604 CHF. Expected value: +$38,596.
Why the Ceasefire Changes Nothing
On April 8 Trump announced a two week ceasefire. Markets surged. Oil dropped 13%. My book lost another 10 percentage points in a day. Here is why I did not sell a single contract.
The ceasefire is not a reopening of Hormuz. In 24 hours, one oil tanker transited the strait. The baseline is 110 per day. 180 tankers carrying 172 million barrels remain stranded inside the Gulf. ADNOC CEO Sultan Al Jaber said today the strait “is not open.”
The last jet fuel tanker from the Persian Gulf arrived at Rotterdam this morning. After that, European supply stops. The Financial Times reports jet fuel shortages at European airports within three weeks. Alexander Stahel called it “a 100% predictable outcome with no solution at this point.”
Futures say oil is $97. Brent spot cargo is trading at $141. That $44 spread is the largest in history. The paper market is being moved by Trump tweets. The physical market is telling you the truth.
Historical Ceasefire Base Rates
Of the last 10 major conflict ceasefires where core issues remained unresolved including Bosnia, Gaza, Libya, Ukraine Minsk, Lebanon 2006- nine out of ten collapsed. The one that held was the Iran-Iraq ceasefire in 1988, after 8 years of war and both sides completely exhausted.
We are on day 40. Iran’s 10 demands and the US position are irreconcilable. Iran wants permanent Hormuz control. The US will never accept that. Iran wants uranium enrichment. Trump explicitly said no enrichment ever.
My probability that this ceasefire holds permanently: 5 to 10%. Polymarket says 34% ceasefire ends by April 21. History says 90%.
The Profit Scenarios
Scenario | Probability | Book Profit
----------------------------------|-------------|------------
Permanent peace deal | 10% | -$2,500
Ceasefire extends, slow burn | 36% | +$8,000
Ceasefire collapses by April 21 | 34% | +$45,000
Full war resumes and recession | 15% | +$130,000
🚨 Black swan: VIX 80, oil $200 | 5% | +$500,000
Total expected value: +$38,596. Against a current book of -1,206 CHF. The negative P&L today is not a thesis failure. It is the cost of being early.
The Michael Burry Parallel
In 2007, Michael Burry’s fund lost 18% while betting against mortgage backed securities. His investors tried to pull their money. He held. By 2008 he was up 489%.
The structure is identical. A macro thesis priced by the market at 5 to 10% probability. A portfolio sitting in drawdown. The thesis getting more confirmed by the day. Ground troops in Iran. Hormuz still closed. IEA calling this the worst energy crisis in history. While the market keeps pricing a return to normality that is not coming.
As Fatih Birol, IEA Executive Director said on April 1: “Today we lost 12 million barrels per day, more than two of the 1970s oil crises put together. The cure is opening up the Strait of Hormuz.”
New Position: AAL Jet Fuel Puts
Added today: 5 x AAL JAN27 $8P at $0.67. The thesis is simple. American Airlines spends 30% of its operating budget on jet fuel. The last Gulf jet fuel tanker arrived in Rotterdam this morning. European airports face shortages in three weeks per the FT. Airlines have no hedging beyond 6 months at $150 and above per barrel oil.
AAL at $11.37. Needs to fall 30% to $8 to activate. At sustained $150 oil, AAL goes to $4 to $5. That $8P pays out $300 to $400 per contract on a $67 investment.
What I Am Watching
Three metrics matter above all else this week.
First, Islamabad talks running today through Saturday. Vance leads the US delegation. If talks collapse, oil spikes, VIX spikes, entire book recovers simultaneously.
Second, Kalshi recession odds. Currently 28%. When they cross 40%, triggered by Q1 GDP data on April 30, SPY puts reprice 3 to 5x overnight.
Third, Hormuz tanker count. Follow @HormuzLetter on X. When it says 10 or more tankers per day, the ceasefire is real. When it says 1 to 2 per day, thesis confirmed and book recovers.
The single most important number: Kalshi recession odds at 28%. Moody’s AI model at 49%. My thesis: 95%. The moment Kalshi crosses 50%, SPY 300P goes from -30% to +200%. That trigger is April 30 GDP data. 21 days.
Conclusion: Hold Everything
The book is down 40.87%. The thesis is more confirmed than it was when I entered. One oil tanker through Hormuz in 24 hours. European jet fuel ending today. Ground troops in Iran confirmed. Polymarket now 100% on US troops in Iran by December.
The market is wrong. It was wrong in February. It is wrong now. It will be wrong in April and May. And when it stops being wrong — when the ceasefire collapses and Hormuz remains closed and Q1 GDP comes in negative — every position in this book reprices simultaneously.
Expected value: +$38,596. Probability of profit: 65%. Time remaining on all positions: 9 months.
Stay ahead.
Aivantaiq. https://t.co/uauvGexg76
This is not financial advice. All options trading involves substantial risk of loss. Options can expire worthless. Never invest more than you can afford to lose completely.
#IranWar #Hormuz #OilPrice #Options #Trading #XLE #MacroTrading #GeopoliticalRisk #EnergyTrading #OptionsTrading #Commodities #OOTT #WTI #Brent #MacroInvesting #BlackSwan #Aivantaiq
@zerohedge@markets@business@Schuldensuehner@MacroAlf@RaoulGMI@elerianm
The Madrid Back Channel: How Pedro Sánchez Became the West’s Most Important Diplomat Nobody Talks About
The West had one back channel to Tehran. It ran through Madrid. Markets never priced it. Here's why that still matters.
While Washington rattled sabres and Brussels issued statements nobody read, Spain’s Pedro Sánchez was doing something far more consequential: quietly building the one diplomatic channel Tehran still trusts from the Western world.
That back channel just became a load bearing pillar in the architecture keeping global markets from collapse.
Thanks for reading! Subscribe for free to receive new posts and support my work.
Nobody in mainstream media is connecting these dots. Here’s what actually happened and why the story is far from over.
Why Tehran Trusts Madrid
Spain is not a Gulf power. It has no aircraft carrier in the Strait of Hormuz. It buys relatively little Iranian oil. By conventional logic, it should be irrelevant to the Iran equation.
That’s precisely why it matters.
Tehran’s calculus has always been simple: it will not negotiate under the barrel of a gun held by the party demanding concessions. Washington is the gun. London is Washington’s echo. Paris and Berlin are sanctions architects. But Madrid? Madrid recognised the Islamic Republic early. Spain maintained trade relationships through isolation periods that other EU members quietly abandoned. And Sánchez, specifically, has cultivated a posture of what his critics call appeasement and his defenders call strategic ambiguity, refusing to treat every Iranian provocation as a casus belli.
The ayatollahs remember who stayed at the table. Sánchez stayed.
The Moment It Mattered
When the Hormuz pressure reached its apex, with Houthi re entry into the Red Sea corridor, US carrier groups repositioning, and oil markets pricing in a blockade scenario, the architecture of back channel communication became the most important real estate in geopolitics.
The public narrative was all Trump deadlines and Pentagon briefings. The private narrative was quieter: who has a number in Tehran that gets answered?
Spain had that number.
The precise content of what passed through Madrid remains opaque. It will likely stay that way for years. But the sequencing is visible to anyone paying attention: Spanish diplomatic activity spiked in the days before the temperature dropped. Sánchez made calls. Statements shifted in tone. The cliff edge that markets were pricing at near certainty suddenly looked less vertical.
This is how real diplomacy works. Not press conferences. Phone calls at 2am that never get transcribed.
What Markets Missed
The options market in the days surrounding the tension peak was pricing an event. VIX term structure was inverted at the long end. Energy vol was elevated across the curve. The Strait scenario, even a partial and temporary closure, represented a systemic shock of a magnitude most portfolio managers had not modelled since 2008.
What markets were not pricing was the back channel.
Because the back channel was invisible. Because it ran through a mid sized European democracy whose Prime Minister most macro traders couldn’t place on a map without help. Because the financial press was watching Trump’s X feed instead of Spain’s foreign ministry.
This is the structural inefficiency that geopolitical intelligence exists to exploit. The signal was available. It was just buried under noise.
Why It Still Matters
The ceasefire in tension, if that’s what this is, is not a resolution. The underlying architecture of conflict remains entirely intact. Iran’s nuclear programme has not stopped. The Houthis have not disarmed. The Strait remains the jugular vein of the global energy system, and the hand around it has not fully released.
What has changed is the existence of a proven channel.
Madrid is now a confirmed node in the crisis communication network. That makes Spain, and Sánchez personally, structurally more important to the next escalation cycle than any NATO communiqué acknowledges. The next time the temperature rises, the calls will go through Madrid again. Markets that understand this will position differently than markets that don’t.
The question is not whether there will be a next time.
The question is whether you’re positioned before Madrid picks up the phone, or after.
Aivantaiq publishes geopolitical intelligence for macro traders and serious investors. If this analysis is useful, share it with one person who trades energy or manages risk.
#IranWar #Hormuz #OilPrice #Options #Trading #XLE #MacroTrading #GeopoliticalRisk #Houthis #RedSea #EnergyTrading #OptionsTrading #Commodities #OOTT #WTI #Brent #MacroInvesting #BlackSwan #Aivantaiq
@zerohedge@markets@business@Schuldensuehner@MacroAlf@RaoulGMI@elerianm@xueqinjiang
https://t.co/UaezK46SGY
The Madrid Back Channel: How Pedro Sánchez Became the West’s Most Important Diplomat Nobody Talks About
The West had one back channel to Tehran. It ran through Madrid. Markets never priced it. Here's why that still matters.
While Washington rattled sabres and Brussels issued statements nobody read, Spain’s Pedro Sánchez was doing something far more consequential: quietly building the one diplomatic channel Tehran still trusts from the Western world.
That back channel just became a load bearing pillar in the architecture keeping global markets from collapse.
Thanks for reading! Subscribe for free to receive new posts and support my work.
Nobody in mainstream media is connecting these dots. Here’s what actually happened and why the story is far from over.
Why Tehran Trusts Madrid
Spain is not a Gulf power. It has no aircraft carrier in the Strait of Hormuz. It buys relatively little Iranian oil. By conventional logic, it should be irrelevant to the Iran equation.
That’s precisely why it matters.
Tehran’s calculus has always been simple: it will not negotiate under the barrel of a gun held by the party demanding concessions. Washington is the gun. London is Washington’s echo. Paris and Berlin are sanctions architects. But Madrid? Madrid recognised the Islamic Republic early. Spain maintained trade relationships through isolation periods that other EU members quietly abandoned. And Sánchez, specifically, has cultivated a posture of what his critics call appeasement and his defenders call strategic ambiguity, refusing to treat every Iranian provocation as a casus belli.
The ayatollahs remember who stayed at the table. Sánchez stayed.
The Moment It Mattered
When the Hormuz pressure reached its apex, with Houthi re entry into the Red Sea corridor, US carrier groups repositioning, and oil markets pricing in a blockade scenario, the architecture of back channel communication became the most important real estate in geopolitics.
The public narrative was all Trump deadlines and Pentagon briefings. The private narrative was quieter: who has a number in Tehran that gets answered?
Spain had that number.
The precise content of what passed through Madrid remains opaque. It will likely stay that way for years. But the sequencing is visible to anyone paying attention: Spanish diplomatic activity spiked in the days before the temperature dropped. Sánchez made calls. Statements shifted in tone. The cliff edge that markets were pricing at near certainty suddenly looked less vertical.
This is how real diplomacy works. Not press conferences. Phone calls at 2am that never get transcribed.
What Markets Missed
The options market in the days surrounding the tension peak was pricing an event. VIX term structure was inverted at the long end. Energy vol was elevated across the curve. The Strait scenario, even a partial and temporary closure, represented a systemic shock of a magnitude most portfolio managers had not modelled since 2008.
What markets were not pricing was the back channel.
Because the back channel was invisible. Because it ran through a mid sized European democracy whose Prime Minister most macro traders couldn’t place on a map without help. Because the financial press was watching Trump’s X feed instead of Spain’s foreign ministry.
This is the structural inefficiency that geopolitical intelligence exists to exploit. The signal was available. It was just buried under noise.
Why It Still Matters
The ceasefire in tension, if that’s what this is, is not a resolution. The underlying architecture of conflict remains entirely intact. Iran’s nuclear programme has not stopped. The Houthis have not disarmed. The Strait remains the jugular vein of the global energy system, and the hand around it has not fully released.
What has changed is the existence of a proven channel.
Madrid is now a confirmed node in the crisis communication network. That makes Spain, and Sánchez personally, structurally more important to the next escalation cycle than any NATO communiqué acknowledges. The next time the temperature rises, the calls will go through Madrid again. Markets that understand this will position differently than markets that don’t.
The question is not whether there will be a next time.
The question is whether you’re positioned before Madrid picks up the phone, or after.
Aivantaiq publishes geopolitical intelligence for macro traders and serious investors. If this analysis is useful, share it with one person who trades energy or manages risk.
#IranWar #Hormuz #OilPrice #Options #Trading #XLE #MacroTrading #GeopoliticalRisk #Houthis #RedSea #EnergyTrading #OptionsTrading #Commodities #OOTT #WTI #Brent #MacroInvesting #BlackSwan #Aivantaiq
@zerohedge@markets@business@Schuldensuehner@MacroAlf@RaoulGMI@elerianm@xueqinjiang
https://t.co/UaezK46SGY
The Madrid Back Channel: How Pedro Sánchez Became the West’s Most Important Diplomat Nobody Talks About
The West had one back channel to Tehran. It ran through Madrid. Markets never priced it. Here's why that still matters.
While Washington rattled sabres and Brussels issued statements nobody read, Spain’s Pedro Sánchez was doing something far more consequential: quietly building the one diplomatic channel Tehran still trusts from the Western world.
That back channel just became a load bearing pillar in the architecture keeping global markets from collapse.
Thanks for reading! Subscribe for free to receive new posts and support my work.
Nobody in mainstream media is connecting these dots. Here’s what actually happened and why the story is far from over.
Why Tehran Trusts Madrid
Spain is not a Gulf power. It has no aircraft carrier in the Strait of Hormuz. It buys relatively little Iranian oil. By conventional logic, it should be irrelevant to the Iran equation.
That’s precisely why it matters.
Tehran’s calculus has always been simple: it will not negotiate under the barrel of a gun held by the party demanding concessions. Washington is the gun. London is Washington’s echo. Paris and Berlin are sanctions architects. But Madrid? Madrid recognised the Islamic Republic early. Spain maintained trade relationships through isolation periods that other EU members quietly abandoned. And Sánchez, specifically, has cultivated a posture of what his critics call appeasement and his defenders call strategic ambiguity, refusing to treat every Iranian provocation as a casus belli.
The ayatollahs remember who stayed at the table. Sánchez stayed.
The Moment It Mattered
When the Hormuz pressure reached its apex, with Houthi re entry into the Red Sea corridor, US carrier groups repositioning, and oil markets pricing in a blockade scenario, the architecture of back channel communication became the most important real estate in geopolitics.
The public narrative was all Trump deadlines and Pentagon briefings. The private narrative was quieter: who has a number in Tehran that gets answered?
Spain had that number.
The precise content of what passed through Madrid remains opaque. It will likely stay that way for years. But the sequencing is visible to anyone paying attention: Spanish diplomatic activity spiked in the days before the temperature dropped. Sánchez made calls. Statements shifted in tone. The cliff edge that markets were pricing at near certainty suddenly looked less vertical.
This is how real diplomacy works. Not press conferences. Phone calls at 2am that never get transcribed.
What Markets Missed
The options market in the days surrounding the tension peak was pricing an event. VIX term structure was inverted at the long end. Energy vol was elevated across the curve. The Strait scenario, even a partial and temporary closure, represented a systemic shock of a magnitude most portfolio managers had not modelled since 2008.
What markets were not pricing was the back channel.
Because the back channel was invisible. Because it ran through a mid sized European democracy whose Prime Minister most macro traders couldn’t place on a map without help. Because the financial press was watching Trump’s X feed instead of Spain’s foreign ministry.
This is the structural inefficiency that geopolitical intelligence exists to exploit. The signal was available. It was just buried under noise.
Why It Still Matters
The ceasefire in tension, if that’s what this is, is not a resolution. The underlying architecture of conflict remains entirely intact. Iran’s nuclear programme has not stopped. The Houthis have not disarmed. The Strait remains the jugular vein of the global energy system, and the hand around it has not fully released.
What has changed is the existence of a proven channel.
Madrid is now a confirmed node in the crisis communication network. That makes Spain, and Sánchez personally, structurally more important to the next escalation cycle than any NATO communiqué acknowledges. The next time the temperature rises, the calls will go through Madrid again. Markets that understand this will position differently than markets that don’t.
The question is not whether there will be a next time.
The question is whether you’re positioned before Madrid picks up the phone, or after.
Aivantaiq publishes geopolitical intelligence for macro traders and serious investors. If this analysis is useful, share it with one person who trades energy or manages risk.
#IranWar #Hormuz #OilPrice #Options #Trading #XLE #MacroTrading #GeopoliticalRisk #Houthis #RedSea #EnergyTrading #OptionsTrading #Commodities #OOTT #WTI #Brent #MacroInvesting #BlackSwan #Aivantaiq
@zerohedge@markets@business@Schuldensuehner@MacroAlf@RaoulGMI@elerianm@xueqinjiang
https://t.co/UaezK46SGY


![bubu_elephant's tweet photo. Post 1/3
Paulson just dropped a “vicious” bond-crash warning on Bloomberg. Japan is repatriating $1.2T in Treasuries.
Gulf oil states are hoarding cash after the Hormuz chaos.
Extreme oil backwardation is the spark. The foreign bid that kept U.S. yields low is cracking. Full breakdown here 👇
[Your Substack link] #Paulson #BondCrash #Treasuries #JapanRepatriation #OilBackwardation](https://pbs.twimg.com/media/HGF_BeGW8AA4tft.jpg)