Senior Federal Budget Fellow @amrenewctr | Fmr Special Advisor to @GlennYoungkin | Trump Treasury Counselor | Fmr Senate & House Budget Committee Director
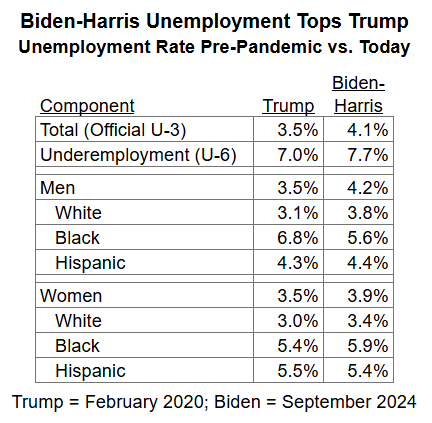
A lame pre-election employment report for VP Harris. There are 12.7 million people who would like to work but can’t find it or have given up looking.
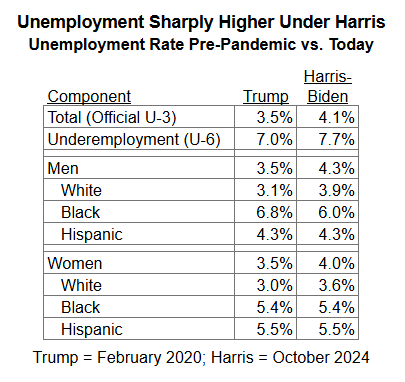
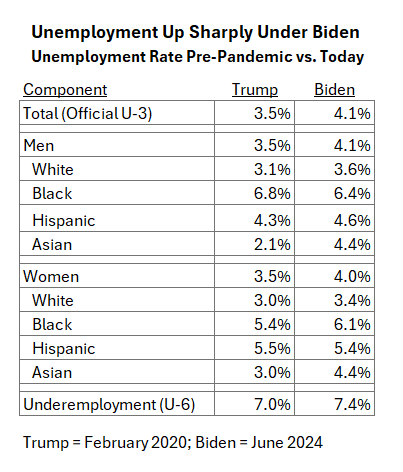
In the DEI economy, only Black males have a lower unemployment rate than they did pre-pandemic. It is much higher for Whites.
One month before the election, inflation miraculously returns to its slowest rise since February 2021?
Here’s the real story:
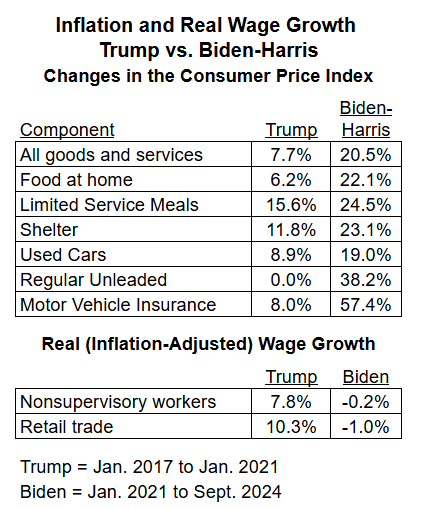
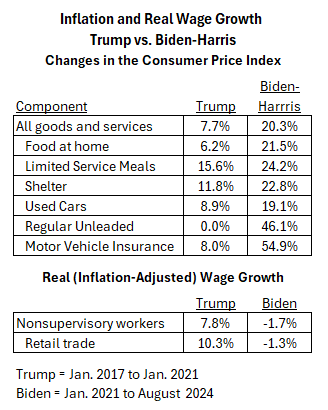
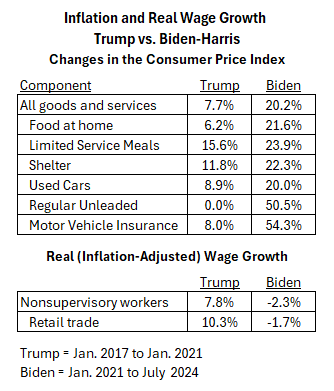
Food at home up 21%,
Take out food +22%,
Gas up 38%, and
Car insurance up 57%.
Wages for workers haven’t kept up.
Are you better off than 4 years ago?
Unemployment at 4.1% under Biden-Harris is sharply higher than Trump’s 3.5%. It’s that much harder today to find a job–especially for the 2.7 million unemployed White men and 700,000 unemployed Black women. Those groups have the suffered the biggest increase in unemployed rate.
Today’s CPI data shows that the cumulative impact of Biden-Harris inflation has made the average worker poorer.
Prices for everyday items are up by 20% to 50% under Biden-Harris, making real (after-inflation) wages lower than they were in January 2021 at the start of their term.
Unemployment today is much higher than under Trump. Underemployment at 7.9% is nearly a full percentage point higher. That’s 1.5 million more people who can’t find work.
Under Biden-Harris, unemployment is lower for women than for men; under Trump it was the same. DEI at work.
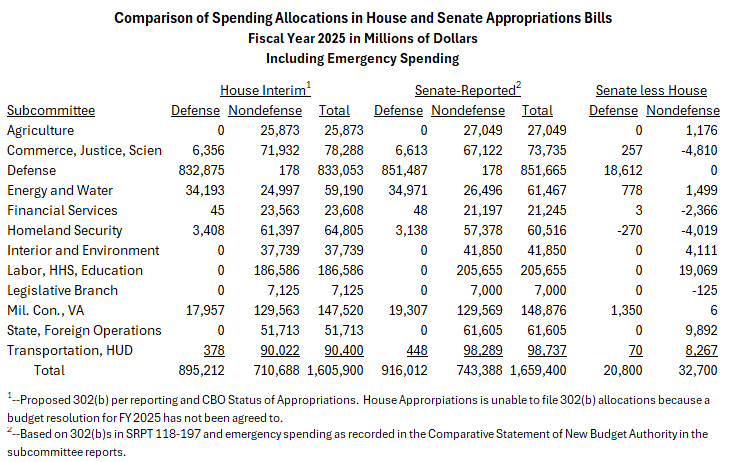
House and Senate Appropriators are $54 billion apart on FY25 spending. To finish the bills this year will require even more $.
Conservatives must insist on a CR till next year to get a better deal.
To learn how we got here and what to do, see below:
https://t.co/8lG1MVmjQ3
Don’t let coverage of today’s ‘tame’ inflation report fool you. The cost of living is up 20.2% under Biden-Harris. Under Trump workers in retail earned 10.3% more after inflation. Under Biden-Harris, the working class makes 2.3% less from the cumulative effect of their inflation.
Unemployment in June has increased, worsening Biden’s record. Unemployment is up for every demographic group except black males and Hispanic women, likely the result of the Biden administration emphasis on DEI.
CBO’s new baseline will lead the left to call for tax increases to reduce deficits. As the graph shows, Biden’s policies—massive new spending, 80,000 IRS agents and nuisance tax increases—have increased deficits by $7.1 trillion.
Let's reverse the spending to eliminate deficits.
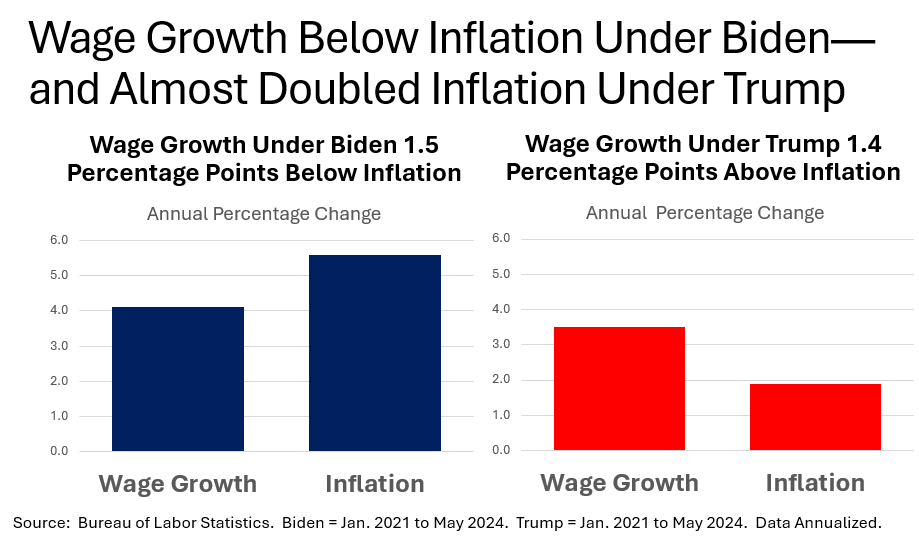
Slowing inflation is good, but only half the battle. Wage growth is substantially below inflation under Biden. Workers fall behind when wages don’t grow as fast as the cost of living.
Under Trump, wages grew almost twice the rate of inflation.
🚨 MAY EMPLOYMENT DATA 🚨
1. There are more people unemployed now than before the pandemic.
2. The Biden Administration’s disastrous DEI initiatives are starting to show in labor data.
See the numbers 👇
https://t.co/2wfeDHyUH0
Unemployment is higher today under Biden than it was pre-pandemic under Trump. Some demographics are doing better than others, likely the result of Biden’s emphasis on DEI policies. The number of employed white males declined contributing to a huge increase in their unemployment.
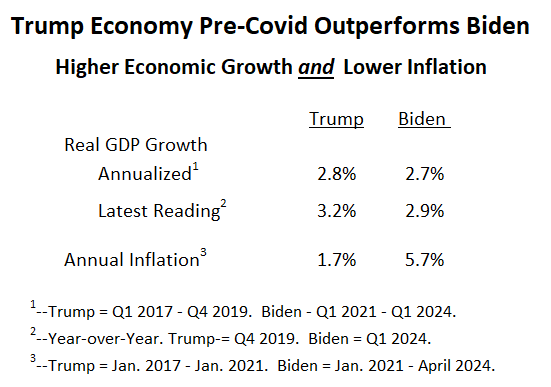
The 2nd revision to GDP estimates for Jan.-March 2024 was released today. The table gives the comparison with the Trump years before Covid.
Biden’s lower growth and higher inflation results in misery for working Americans.
MUST-READ: CRA Sr. Fellow Dan Kowalski (@budget_crank) says the DC Cartel is trying to hamstring President Trump by “clearing the decks.”
A CR until March 2025 would give the next president the ability to CUT woke & weaponized spending.
HERE'S HOW 👇https://t.co/L1Ja6Tqh78
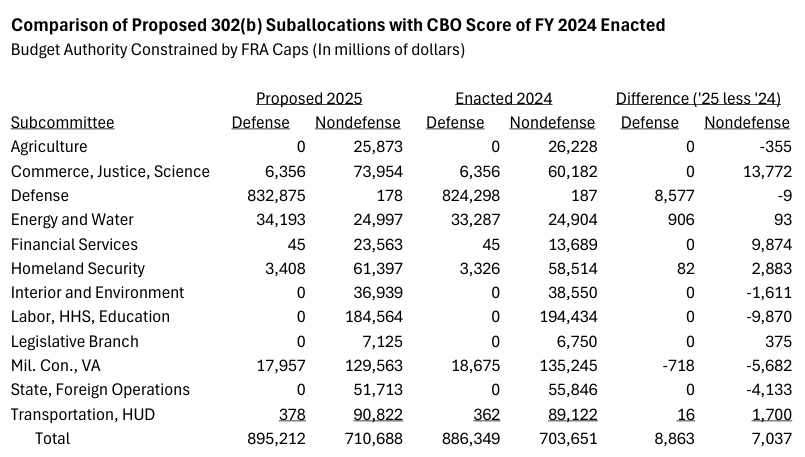
FY 25 proposed appropriations compared with FY 24. Gimmicks in the FY 24 enacted bills cause decreases in nondefense spending for most subcommittees despite 1% top line increase. Gimmicks totaled $10.3 billion in Financial Services (IRS rescission), and $13.7 billion in Commerce.
5/5: Inflation over the last 6 years was 24%, or an annual increase of 3.7%. Federal spending has grown more than twice the rate of inflation since the Trump tax cuts were enacted.
It’s the spending that’s unaffordable, not the tax cut.
1/5: Much is being made of CBO’s estimate yesterday that extending the Trump tax cuts would cost $4 trillion over the next 10 years.
Let’s put that estimate into perspective.
THREAD . . .
4/5: In the 6 years since the tax cuts were signed (FY 2018) and today (FY 2024), federal spending is projected to increase to $6,442 billion from $4,109 billion.
That’s an increase of 57%, or 7.8% per year.