If your first response to the Tesla Roadster is "is that safe??", you've lost all sense of wonder.
Safety is not and never was the meaning of life. I'd happily spend a few micromorts on a flying car.
(Also, Tesla has a sterling safety record, so probably won't even need to).
We're working on a new math font. It's a bit controversial, because people are used to classic serif math fonts. Ours is sans-serif, built from the monospace fonts in code editors
You can now create publication-quality maps with GeoLibre, thanks to the amazing Layout Composer plugin created by Defani Arman Alfitriansyah! It works like the Print Layout in QGIS, and it has lots of functionalities.
Try it out: https://t.co/sUQ2N9ajvm
GitHub: https://t.co/mxvFQidR4C
#opensource #geospatial #GeoLibre
Sulla mappa puoi validare più in fretta una tesi d’investimento immobiliare (infatti la piattaforma qui è per sviluppatori immobiliari, costruttori, società di investimento e asset manager)
• Servizi essenziali OSM (supermercato, farmacia, parcheggio, ristorazione, TPL, scuole) entro un raggio regolabile (300–2.000 m), solo intorno al lotto selezionato
• Tesi di screening qualitativa per obiettivo d’uso (trasformazione, rigenerazione, dismesse…)
• Layer alluvioni/frane ISPRA in consultazione visuale + checklist rischi (grandine ancora fuori per mancanza di layer open)
• Prezzo del lotto in scheda quando è presente nella fonte
• Dossier PDF con identità, servizi, rischi e gap residui
Cosa si può fare con i dati pubblici e un uso massiccio dell’AI?
Dopo https://t.co/y7O2V0n7IN e https://t.co/DgmN2yi0m1, mi sono chiesto dove applicare lo stesso approccio per aiutare chi deve prendere decisioni di investimento.
Ho iniziato dall’immobiliare e ho costruito edificAI: una dashboard interattiva, per ora sulla Lombardia, che mette insieme:
• 23.013 perimetri urbanistici: 14.124 di trasformazione, 3.287 di rigenerazione urbana e 5.602 relativi ad aree dismesse o degradate
• Oltre 1,9 milioni di attestati energetici residenziali, aggregati per comune
• 1.501 comuni in mappa, nelle 12 province lombarde
• La cartografia catastale pubblica, con particelle consultabili.
Puoi esplorare la mappa, filtrare le aree per destinazione e superficie, aprire le schede urbanistiche, consultare i documenti disponibili e salvare o esportare una selezione.
L’ho pensata soprattutto per sviluppatori immobiliari, costruttori, società di investimento e asset manager: chi cerca aree da sviluppare o immobili da riqualificare e deve capire dove approfondire.
La logica è la stessa dei miei progetti pubblici: aggregare dati dispersi, renderli consultabili e usarli per orientare le scelte e creare valore per chi decide.
Vorrei farla provare gratuitamente a 5 aziende del settore immobiliare, estendendo la copertura ai territori in cui operano, con l’obiettivo di raggiungere tutta Italia.
Se ti interessa provarla, scrivimi.
Played around with an idea for a wildfire analysis tool
Visualizes wildfire progression over time, tracks hot spots with drones and monitors firefighting efforts
Made with Opus 5.5
I built a growing gallery of motion graphics made with Claude Opus 5.5, each shown next to the prompt or skill that made it.
226 so far, all pulled from posts here and credited to their creators.
https://t.co/pAGK4Y8Yqs
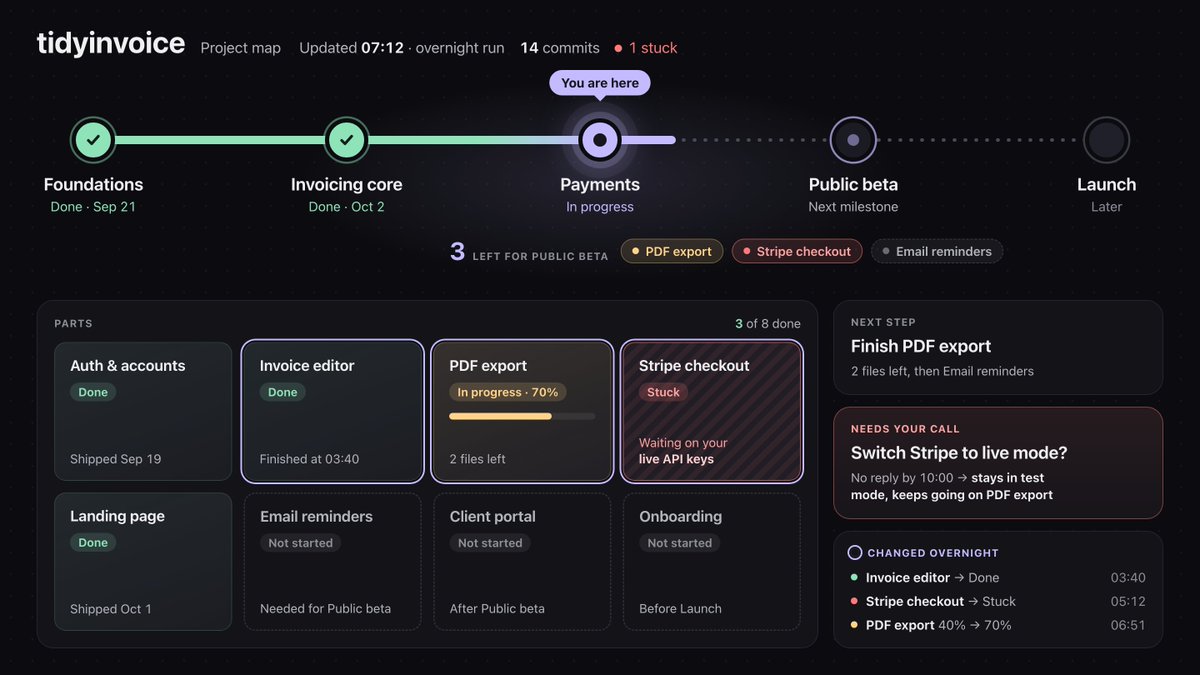
Every time you let Opus 5.5 work on a project overnight, have it vibe-code a quick 𝗽𝗿𝗼𝗷𝗲𝗰𝘁 𝗺𝗮𝗽 like this first. In the morning, you'll see at a glance what's done and what's left.
Then give it 𝗮 𝘀𝘂𝗯𝗮𝗴𝗲𝗻𝘁 𝘁𝗵𝗮𝘁 𝗼𝗻𝗹𝘆 𝗱𝗿𝗮𝘄𝘀 𝗽𝗿𝗼𝗷𝗲𝗰𝘁 𝗺𝗮𝗽𝘀:
→ Name it project-map, set its effort to medium, and preload a design skill
→ The first time, it asks what style you like and saves it to memory. After that, every map fits your taste and the project at hand
→ Call it before you let Opus run on its own. It draws the map in the background in a few minutes while the main session keeps coding on high, and it updates the map after every milestone
→ The map shows four things: the parts the project breaks into, how far each part has gotten, 𝘄𝗵𝗮𝘁'𝘀 𝘀𝘁𝘂𝗰𝗸 𝗮𝗻𝗱 𝘄𝗵𝗮𝘁 𝗶𝘁'𝘀 𝘄𝗮𝗶𝘁𝗶𝗻𝗴 𝗼𝗻, and what to do next (if you don't make the call, it goes ahead with that)
Send this prompt to Opus 5.5 in Claude Code 👇
"Set up a subagent that only draws project maps:
1. Create project-map in ~/.claude/agents: model: opus, effort: medium, memory: user. Preload the design skills I have installed (for example impeccable). It needs to read the code, git history, and issues (if there are any). It only writes to a .project-map/ folder in the project, and adds that folder to .gitignore.
2. The first time, run it in the foreground so it can ask me what style I like: dark or light, and one accent color. It saves my answer to memory and follows it every time. If I already have dashboard-builder, reuse the style it saved and don't ask me again.
3. The map is one HTML file that opens with a double-click. It breaks the project into a few main parts and marks each one done, in progress, not started, or stuck. For stuck parts, say what they're waiting on. Milestones live in the map: if I can't name them, read the README and commit history and propose a first version for me to edit. At the top, show how many things are left before the next milestone and a suggested next step, and highlight the parts that changed since the last update. Pick the other panels for this project; don't use a template.
4. Add a rule to ~/.claude/CLAUDE.md: before you run on your own for a long stretch, have project-map draw a version in the background; update it after every milestone; when I ask "where are we?", answer from the map. Follow the map's suggested next step. Put anything that needs my call in the map, and if I don't answer, keep going with the default. Leave any existing dashboard rule as it is.
Show me the contents of the files you'll create or change, then explain the whole flow in words a 10-year-old could follow. Don't write anything until I confirm."