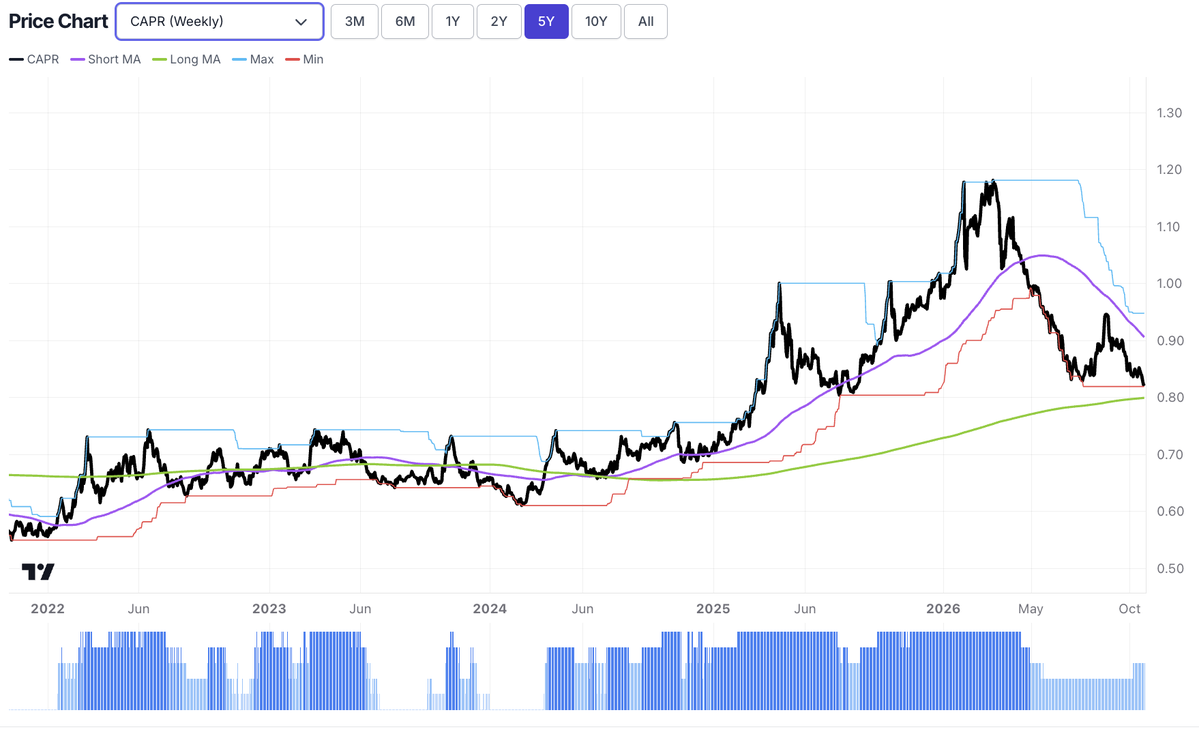
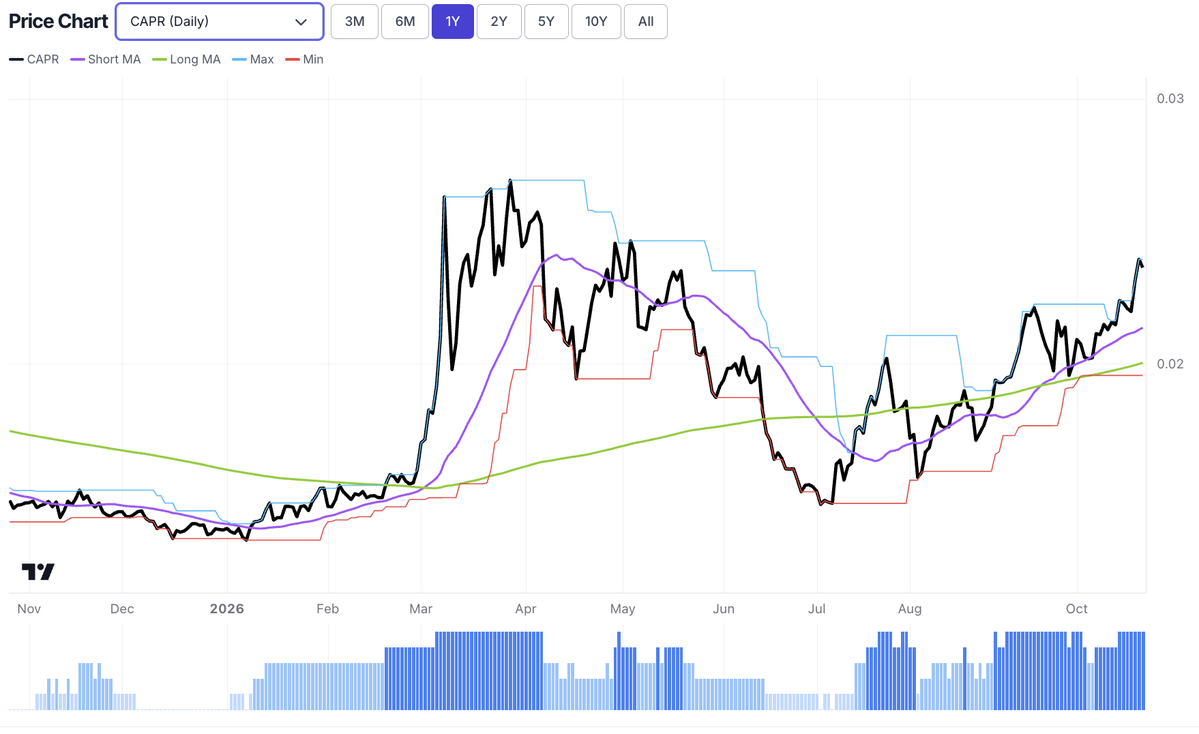
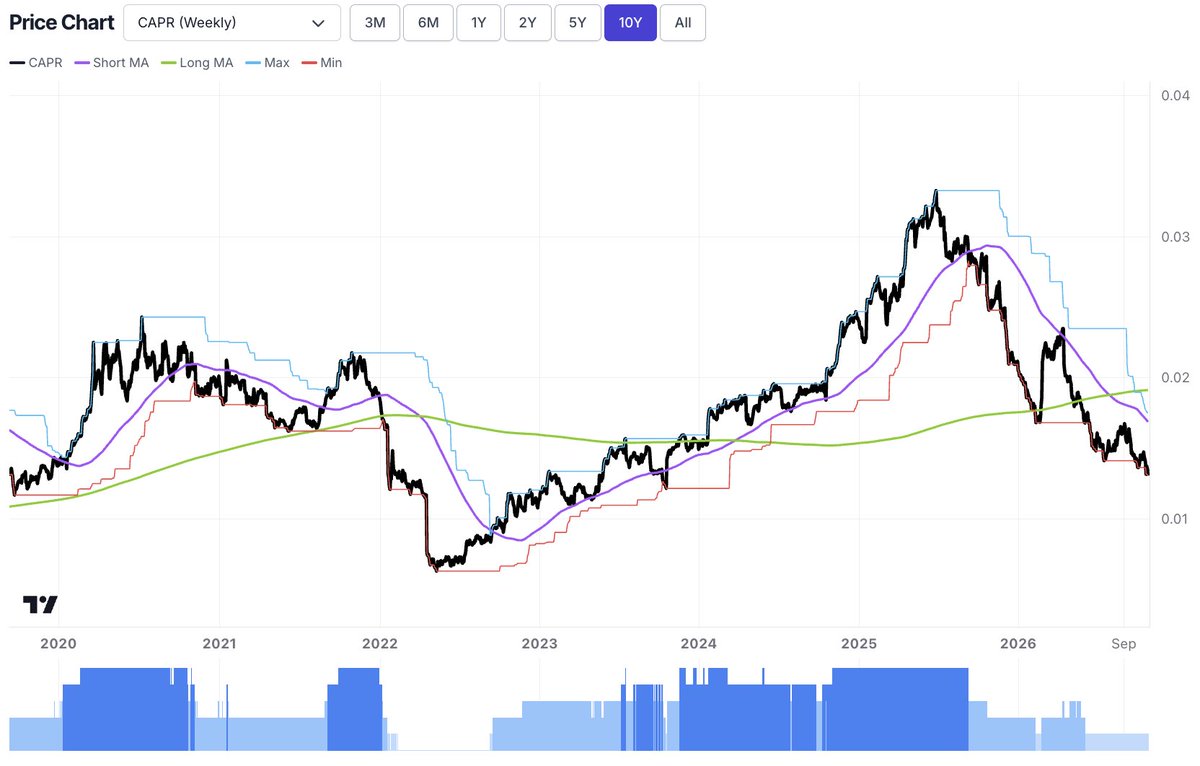
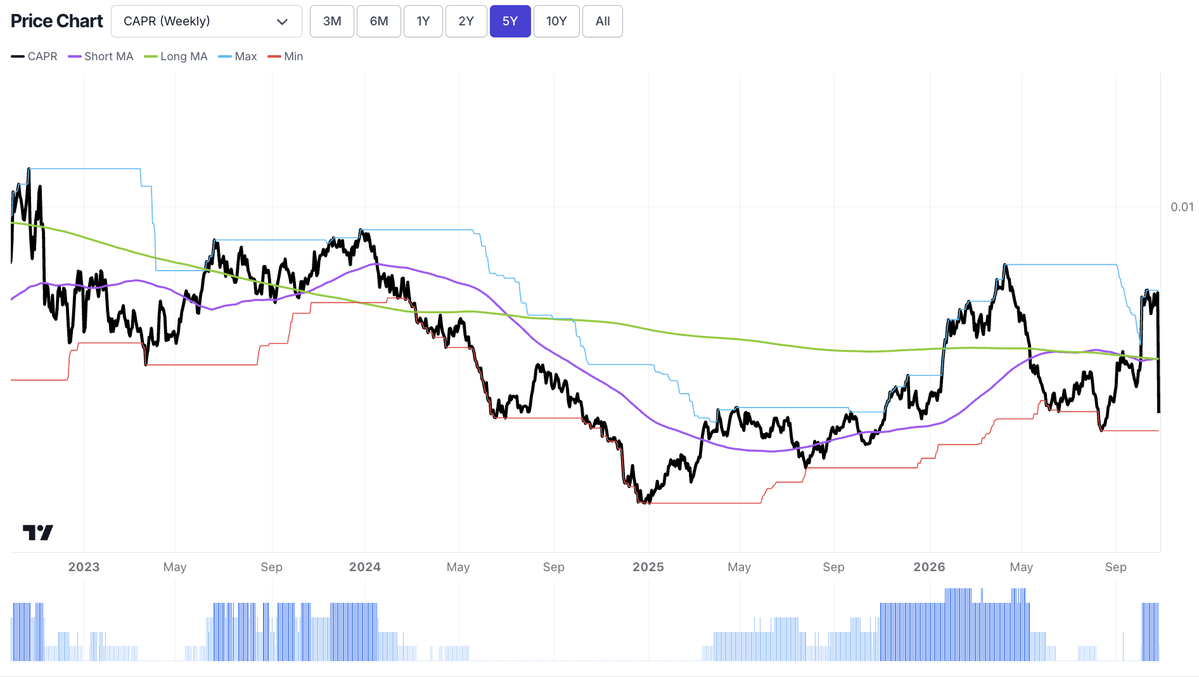
ByteTrend is a unique and powerful trend-following system to help investors make better decisions. Crypto coverage can be found at @BytetrendCrypto. @ByteTree
Trend following enhances returns and controls risk.
Also known as the momentum factor, it is one of a handful of factors in investing with a proven ability to generate alpha.
This month, @ByteTree has relaunched ByteTrend (https://t.co/DsMSj1LTx4) to help investors analyse, understand, and capitalise on the momentum effect.
The chart shows the returns from buying winners (blue) vs buying losers (red). The momentum effect has generated a 16x return over the past thirty years.
Gold (shown) and silver both score 0, and silver is down 16% in a month.
However, their long-term relative (CAPR weekly) trends remain intact, i.e. above their 200W moving averages.
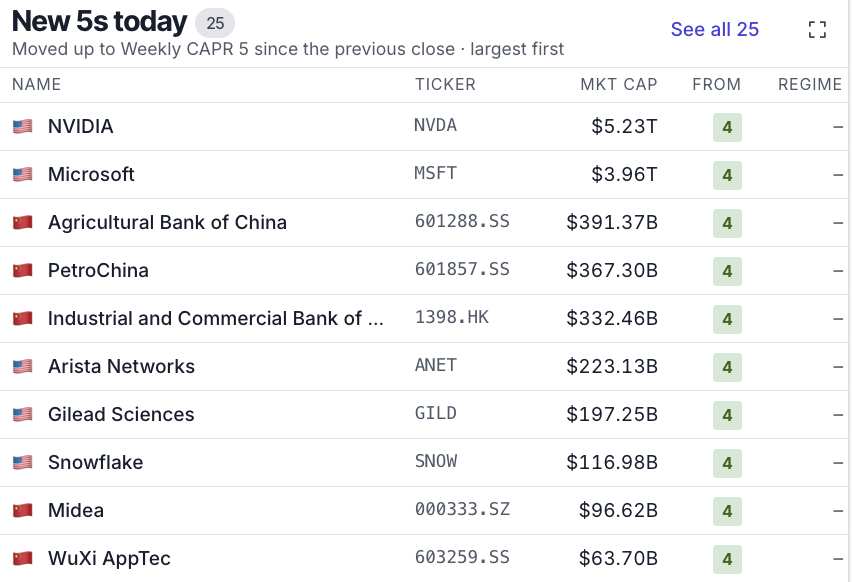
$NVDA, $AAPL and $MSFT, the three largest stocks in the world, are all on ByteTrend scores of 5 again.
This measures their long-term trend relative to the world index $ACWI, ranked from 0 to 5.
$META went the other way yesterday, falling from 4 to 2.
Where's the alpha in markets today?
Where is it moving to, and from?
ByteTrend data breaks this down into a map of global alpha. Here's what changed in the last week ⤵️
$GOOGL hit a fresh 30-week relative low (vs world stocks $ACWI) on Monday.
ByteTrend score: 5 in early August, 2 now.
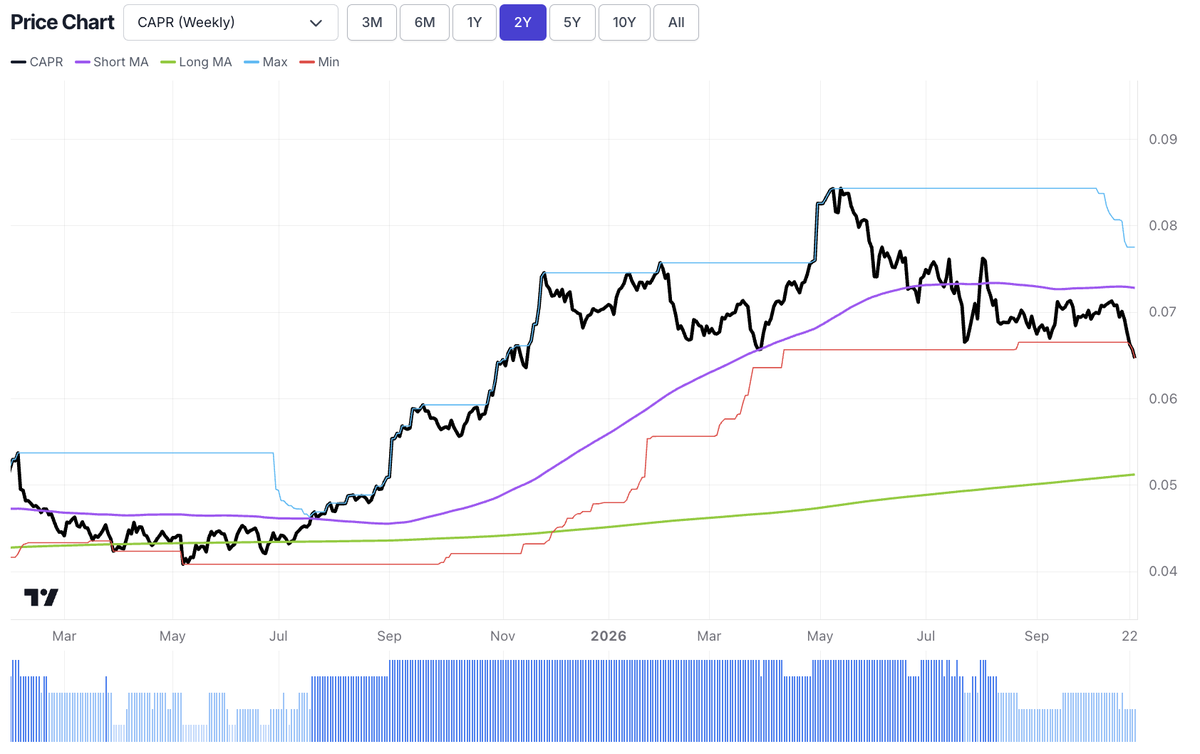
$NFLX (chart shown) and $UBER are also at lows, on 1.
Following a period of severe weakness in 2024, Brazil $EWZ had rebuilt momentum in late-2025.
More recently, it had held a solid weekly CAPR (relative) trend score of 4 since the first round of voting.
The shock Lula win has sent it straight back to 0.
Following a period of severe weakness in 2024, Brazil $EWZ had rebuilt momentum in late-2025.
More recently, it had held a solid weekly CAPR (relative) trend score of 4 since the first round of voting.
The shock Lula win has sent it straight back to 0.
@Barchart Different picture in relative terms (vs $ACWI) - where it has failed to make new highs and clearly broken below its 30-week MA.
https://t.co/Sb9LcBBddq
Semiconductor Trend Has Broken
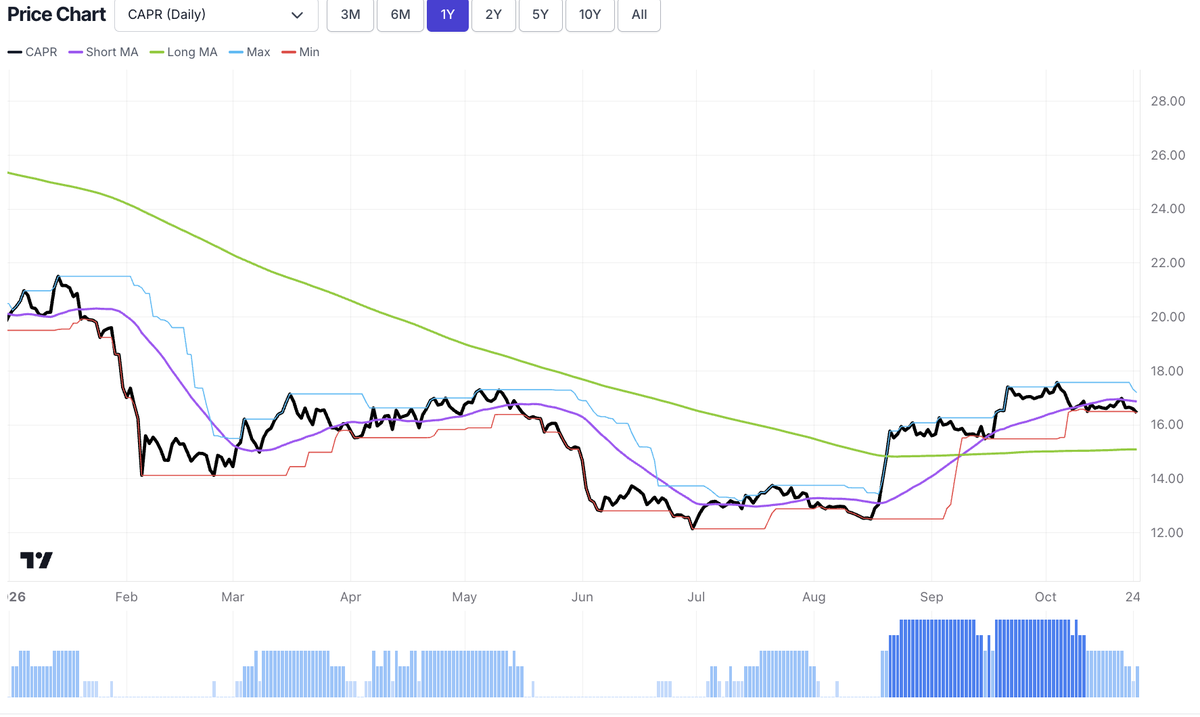
The most notable trend change in recent months is in semiconductor stocks, shown here by the $SOXX ETF.
These have been in a bull market since early 2023, enjoying a (nearly) uninterrupted relative trend (CAPR) score of 5 since June 2025.
However, over the past month, the weekly trend has slipped to a 4 and is now a 3.
Meanwhile, its daily CAPR score is now a 1. Having failed to make a new relative high, it has broken below its 30W CAPR moving average and is making new relative lows.
This is a bearish chart for semis.
Excellent thread breaking down what changed in markets over the past week, as the powerful rotation continued under the surface of a placid world index $ACWI.
Breadth, sectors, countries, themes, stocks, and more, data from @ByteTrend.
$GOOGL has broken down, relative to the world index.
It has now underperformed the world index since November 2025, falling from a weekly trend score of 5 to 2 in the process.
The short term trend is broken, but the long-term one remains intact for now...
Market Breadth Is Rebounding
A month ago, 48% of stocks had a short-term (daily) relative trend (CAPR) score of 0. Half of stocks were strongly underperforming the world index.
Today, that has fallen to 29%, as weak stocks have rebounded, enjoying renewed attention as the AI trade falters. Breadth was at its most extreme level since the 2008 Financial Crisis in September.
A good reminder to always be short extremity.
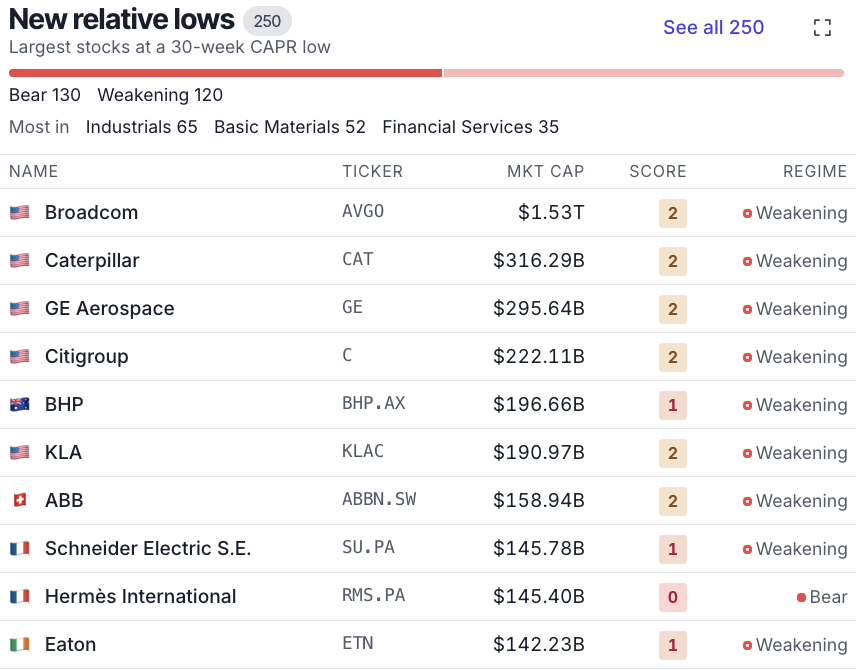
A $1.5 trillion company just hit a 30-week relative low.
$AVGO isn't alone. $CAT $GE $C $KLAC $ETN $BHP are all on the list.
250 names. 130 in Bear. Industrials lead the exodus.
A map of global momentum ⬇️.
Which are the strongest regions and sectors in the world?
This table shows you - using the average relative (CAPR) trend score for each cross, from US Technology to LatAm Utilities to Middle Eastern Real Estate.
250 stocks just hit 30-week relative lows. 130 are already in Bear.
The biggest names on the list:
$AVGO $1.53T
$CAT $316B
$GE $296B
$C $222B
$BHP $197B
$KLAC $191B
Industrials (65) and materials (52) are bleeding hardest.
The AI infrastructure trade is cracking.
250 stocks just hit 30-week relative lows, led by Broadcom $AVGO at $1.5T.
Look who's with it: $KLAC $ETN $CAT $GE, Schneider, ABB. Picks and shovels for data centres and the grid.
Even Hermès is now in Bear.
Finally, short-term shifts:
Short-term momentum is broadening. On the Daily scores, the share of 5s rose from about 13% to 17%.
More names are at 30-week relative highs than a week earlier, but more are also at lows. That’s a widening spread between winners and losers, not a one-way move.
Defensive $XLP names are where Weekly scores are most likely to rise next.
$XLK $XLV $XLI
Geography:
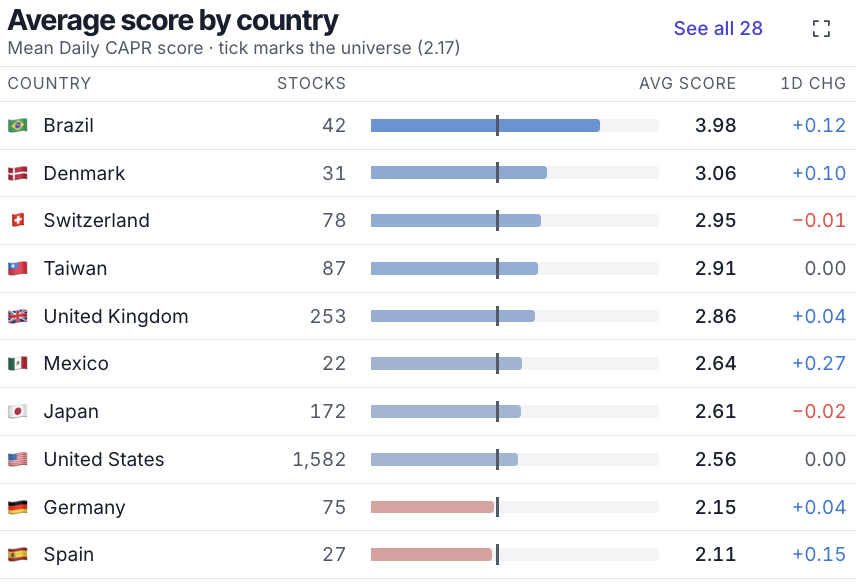
Japan is still the strongest major market, with about a sixth of names at 5.
Latin America is the strongest region and improving (Brazil election will change this).
The UK and Europe were broadly flat to slightly softer.
China and India kept weakening. In each, about half of names score 0, and India fell 4% on the week.
$EWZ $SPY