Inflation strikes again, but this time you might actually like it! The console already had $() and $$(), @FirefoxNightly, now has $$$(), which returns an array of nodes matching the selector, including those in the ShadowDOM. This should make working with Web Components easier 🙂
Firefox 131 was released this weeks and we're really excited because it comes with new superpowers for debugging CSS variables and other Inspector improvements:
https://t.co/5V4F39oYqh
#css#webdev
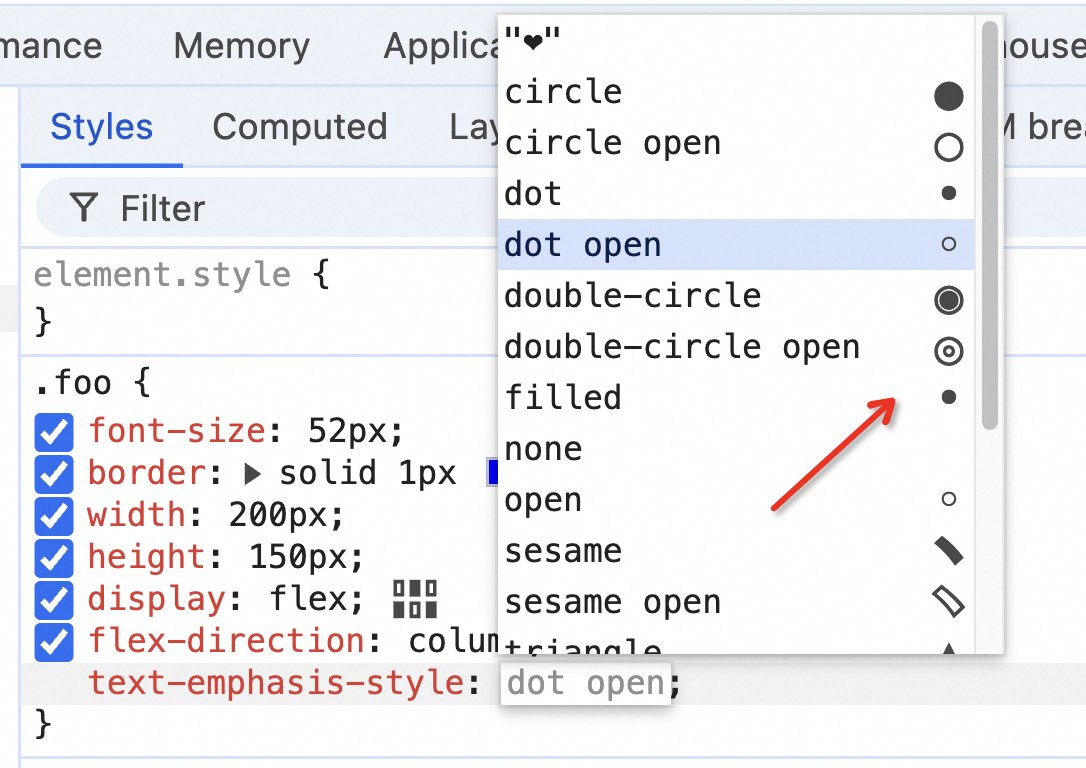
I've implemented a visual preview icon for the text-emphasis-style property of Chrome DevTools. Let me know what other properties you need to add previews for, such as `cursor`, `list-style-type`, etc.
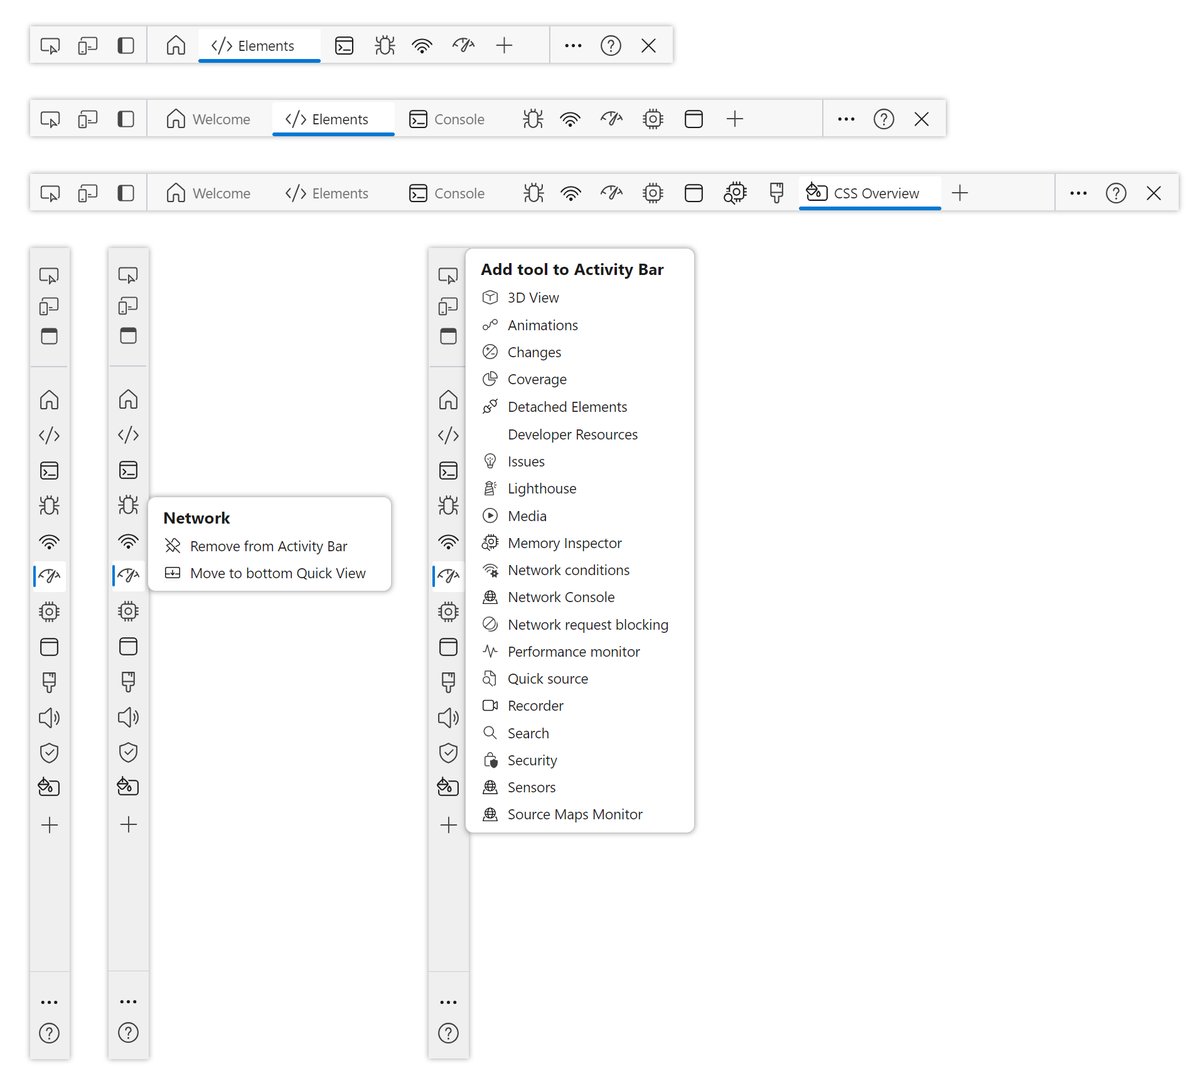
We recently introduced a new Activity Bar that makes it easier to recognize and discover the available Edge DevTools ⭐
Learn more about the all-new Activity Bar, and its icons:
https://t.co/m6WpBC8SRO
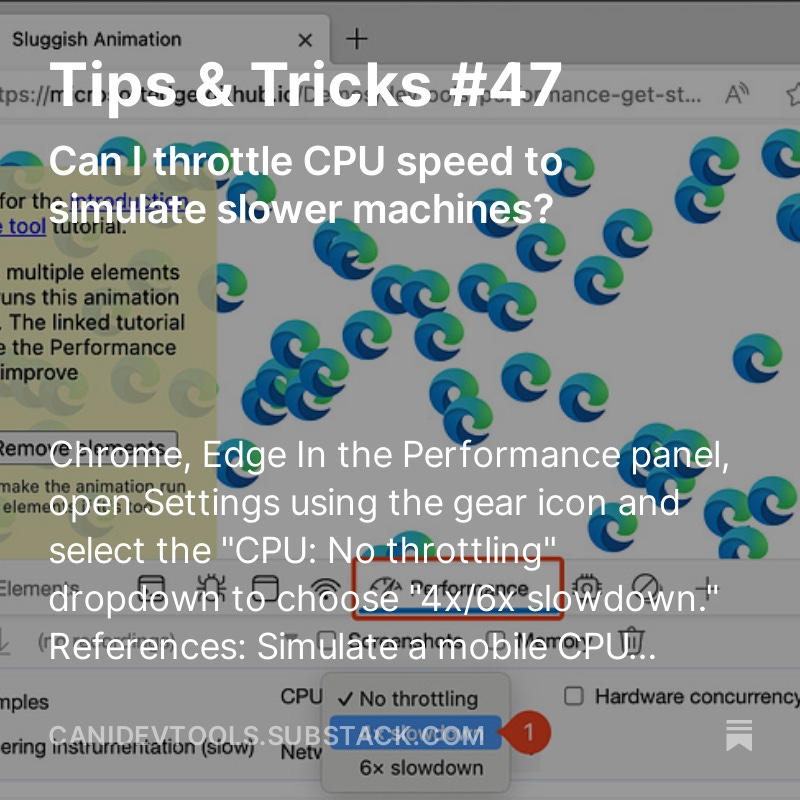
"Throttle CPU speed"
Can I throttle CPU speed to simulate slower machines?
✅@EdgeDevTools
✅@ChromeDevTools
1⃣Open DevTools > Goto the Performance tab, open Settings using the gear icon and select the "CPU: No throttling" dropdown & choose "4x/6x slowdown."
⬇️ link below
Clear network log
➡️ @ChromeDevTools@EdgeDevTools
1⃣In the "Network" panel, click the "Clear network log" button in the toolbar.
2⃣Or Press "Cmd+K" (Windows/Linux) or "Ctrl+L" (macOS) to clear all the network requests in the table.
⬇️ Link
@ChromeDevTools@EdgeDevTools ⬇️ continue
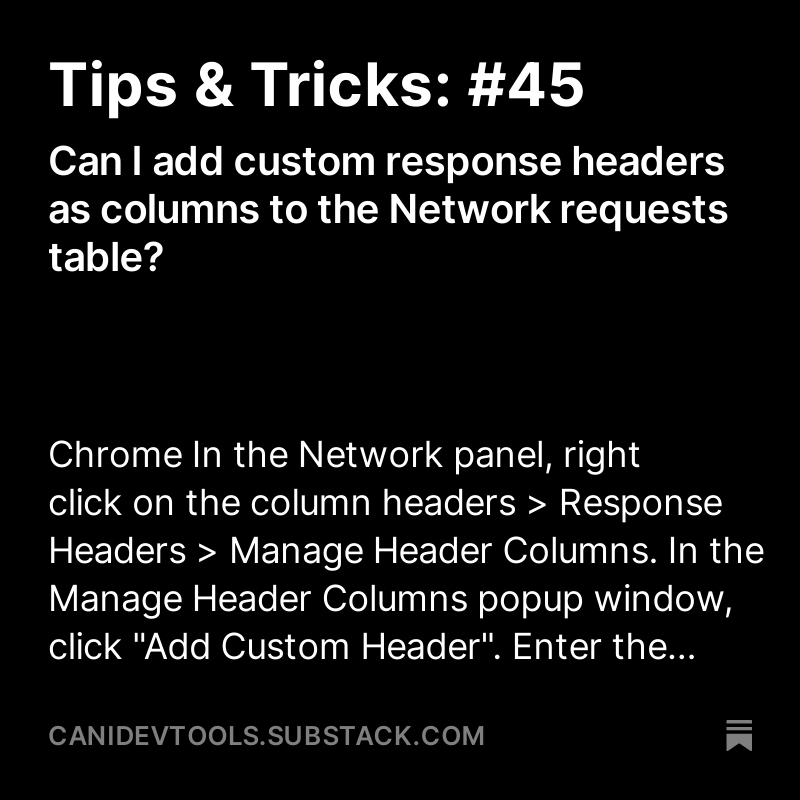
3⃣ Enter the custom header name, and click Add to add a new column to the Network requests table.
🌐 https://t.co/4D5GtvNImU
Inspect custom element
@FirefoxDevTools
◆ Open the Inspector panel. Custom elements are decorated with the custom badge to make them easier to identify them in the Element tree.
◆ Click the badge to directly jump to the JavaScript source code in the Debugger panel.
⬇️ more