🔥Only a few spots left for our first Data Visualisation Paris meetup next Tue! 🇫🇷
Our brilliant speakers—@ladataviz@datacitron@YvanFornes—have prepared top content! We'll also try to host a panel discussion🤞
👉https://t.co/rMZDkfWVov
#dataviz#datavisparis@lucie_bailly
NEUES VIDEO!!! Warum sehen Diamant und Graphit so verschieden aus? Welche Farbe ist die Farbe des Kapitalismus? Ist es sinnvoll, mit Diamanten verzierte Verlobungsringe zu kaufen? Ich mache ein EXPERIMENT mit Strom, um das herauszufinden.
https://t.co/XhGszdTswS
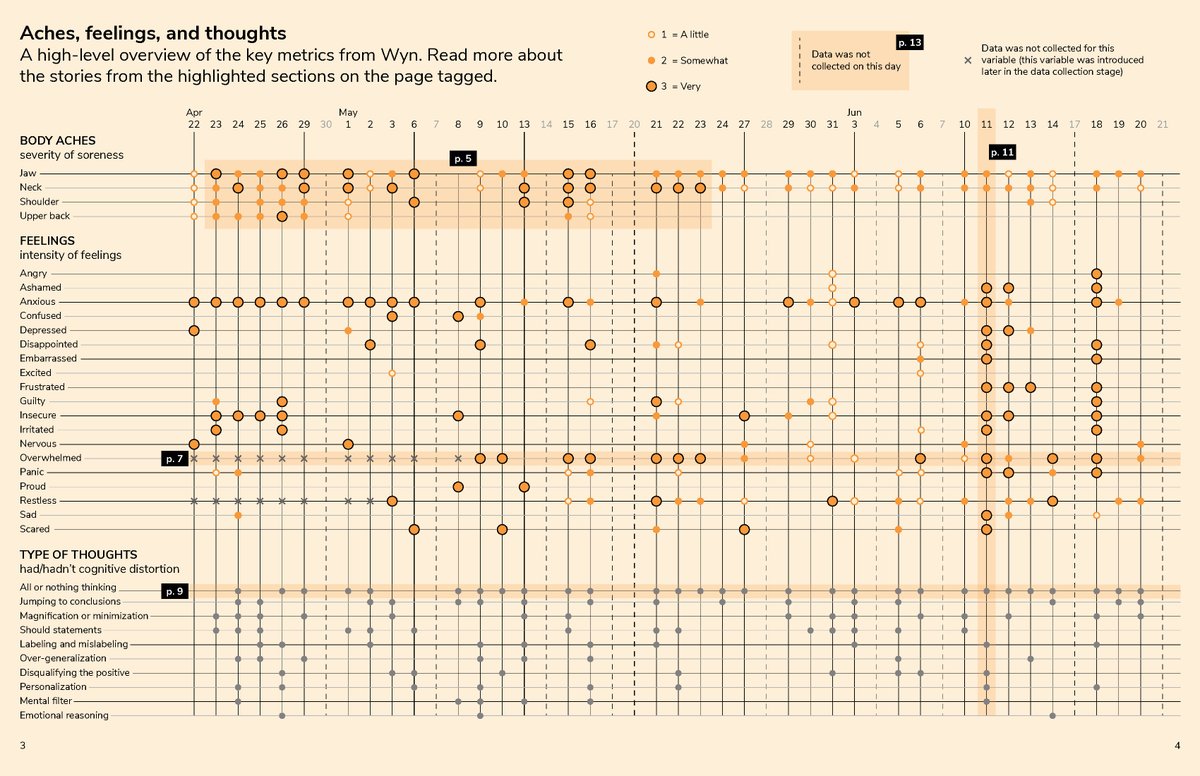
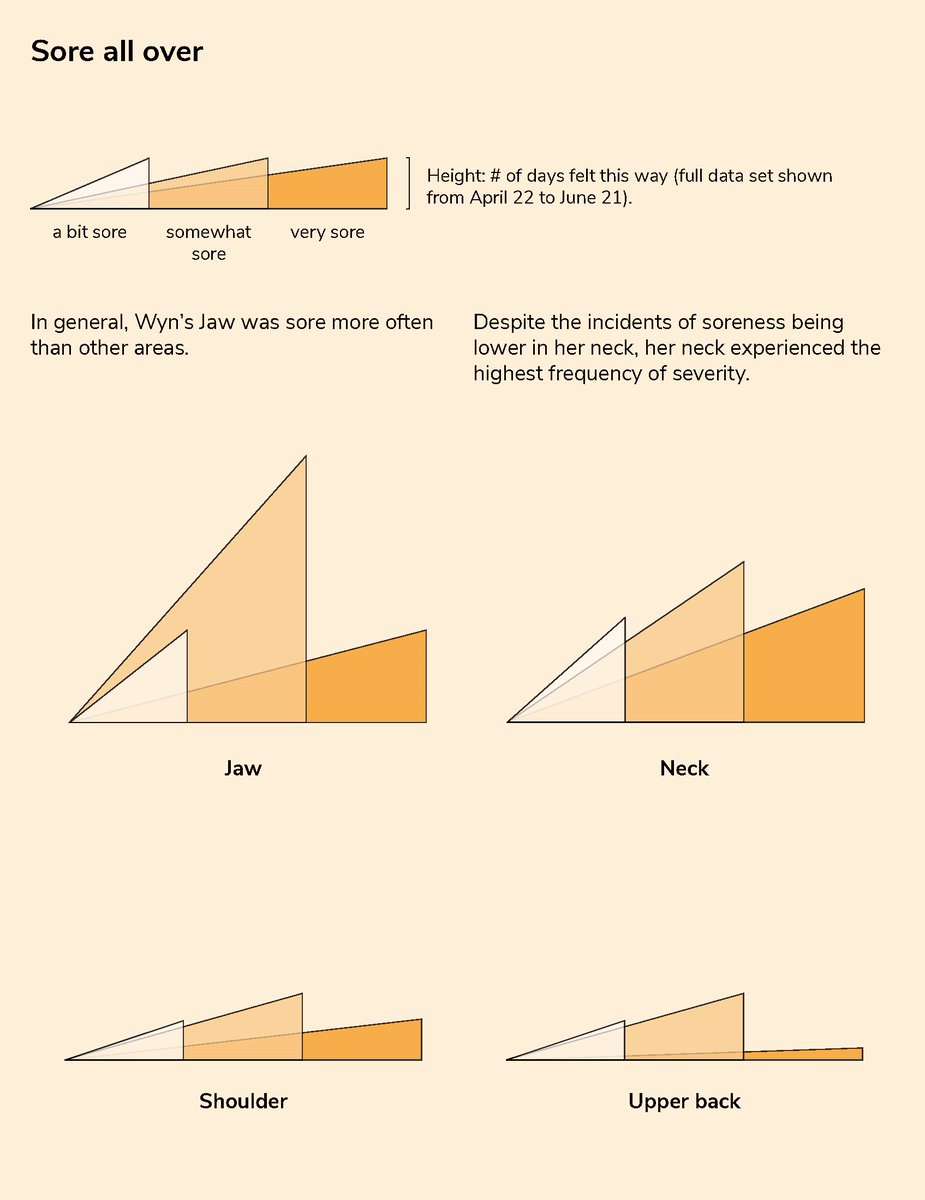
I designed a new booklet-> "Beyond the Surface: Data visualizations of mental health". It documents my mental health and visualizes the data over the course of 3 months. See the full project here: https://t.co/RWrc2ZXm8z /1
🥳My first Chart Doktor video is out! 🥳
This one is in German, but I plan the following videos in English. Please give me feedback! Do you like this format? Would you prefer German or English?
https://t.co/hTC9XBEB9k
👏 Auch am heutigen Mittwoch ist wieder eine neue Episode unseres #Podcasts online gegangen, und zwar mit @GabrieleHorcher, Kommunikations-Wissenschaftlerin und geschäftsführende Gesellschafterin der Kommunikationsagentur @MoellerHorcher.
🔻Siehe erster Kommentar🔻
#KI#PR#IT
Today we are looking forward to the interesting talk of Martha Bennett, Forrester about „How to Drive Data Literacy within the Enterprise“ @Qlik_DACH#datarevolutiontour#qlik - #dataliteracy
#criticalthinking ist eine Pflicht in digitalen Zeiten:
Russian Trolls and Bots Spread Anti-vaccine Lies on Twitter in Run-up to 2016 Election https://t.co/gAAdih2dAk
Leider kommt das Thema #DataLiteracy auf der Konferenz nicht vor 😳 - dabei ist dies der erste Punkt im Kompetenzrahmenwerk der EU 2017 für die Digitalisierung. Der letzte Meter in der Digitalisierung bleibt analog. Wir empfehlen mehr auf die Kompetenzen der Menschen zu achten ..