Yeah! Today is the day. 🔥🔥🔥
We are launching our
⇨ brand new
⇨ free
⇨ crash course
⇨ on storytelling for dashboards.
#DataAnalytics#dataviz#Datavisualization
https://t.co/JFv6hI370H
🎥 Video >> https://t.co/OYw3l3sVCk
Need a quick recap of the #Tableau Conference but don't have an hour and a half to spare? Look no further! I've put together a 15-minute roundup of the entire keynote that will give you all the highlights you need. #Data23
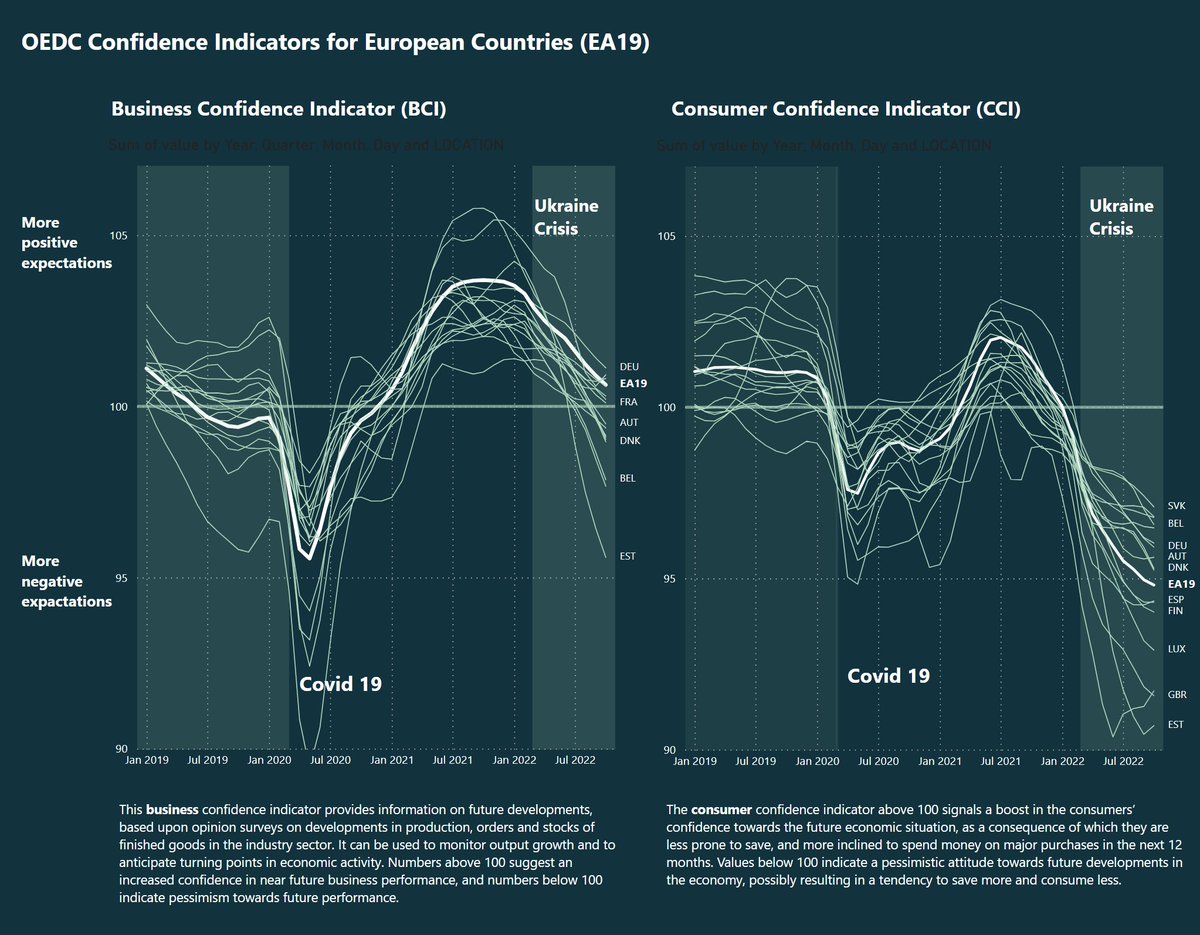
EU Consumer vs. business confidence indicator:
consumer see Ukraine crisis much more critical than Covid-19 - this tells us recent data from OECD (30th. of November 2022).
Data were sourced from official OECD website and visualized w Power BI https://t.co/kQRqa8nQY7
We are announcing our next online data bootcamp Beyond Numbers. Learn how to design great data products and dashboards with a lot of outstanding examples and content.
You are invited to register now:
https://t.co/cfl0ak1p3I
Have you ever tried Streamlit, a python based data app for machine learning and data science?
I’m keen to learn about your experiences ...
#dataviz#datascience#ArtificialIntelligence
https://t.co/QxZC5Be8NT
„Leon, es waren Menschen, die das getan haben.“ Kurz nach dem 9. November durfte ich die KZ-Überlebende Margot Friedländer treffen und mich mit ihr über Antisemitismus, jüdisches Leben in Deutschland und ihre eigene Biografie unterhalten. 1/3
DataFest Tbilisi 2020 - day 2 has officially started!
@evelynmuenster is holding a workshop right now in Design track and she brought us her own sleeping data!
Meet the speakers of #DataFestTbilisi@evelynmuenster is a #datavis designer specialized in data products. She designs data visualizations that enable actionable insights and explain complex things in a way that the audience understands easily.
More info: https://t.co/BckV70Qx4a
🥳My first Chart Doktor video is out! 🥳
This one is in German, but I plan the following videos in English. Please give me feedback! Do you like this format? Would you prefer German or English?
https://t.co/hTC9XBEB9k
Chart Doktor Sprechstunde #1: Review und Remake (naja bisschen zumindest) einer @spiegelonline Grafik über #coronavirus und #Kriminalität.
https://t.co/dLVnUPaKEK
@cavalry__app Hey guys, I am really fascinated by your tool and YouTube tutorials. Please do everyone who is not a native speaker a favor by improving pronunciation by the speaker of the videos. He swallows too many keywords 🙃
Zu #Merz und seiner Rechtsextremismus-Antwort: Habe hier beschrieben, wie sich das genau abspielte und was an der Szene so bitter ist https://t.co/ptQ8g5CofJ
🎉 We're back! In the next few weeks, we will read six #dataviz research papers and discuss them on Tuesday, 17th of March at 6pm UTC here: https://t.co/8M0tqGvKtC
Why should you read papers with us? And how does it work? And which papers? Find out here 👇https://t.co/G8mvw8RC2x