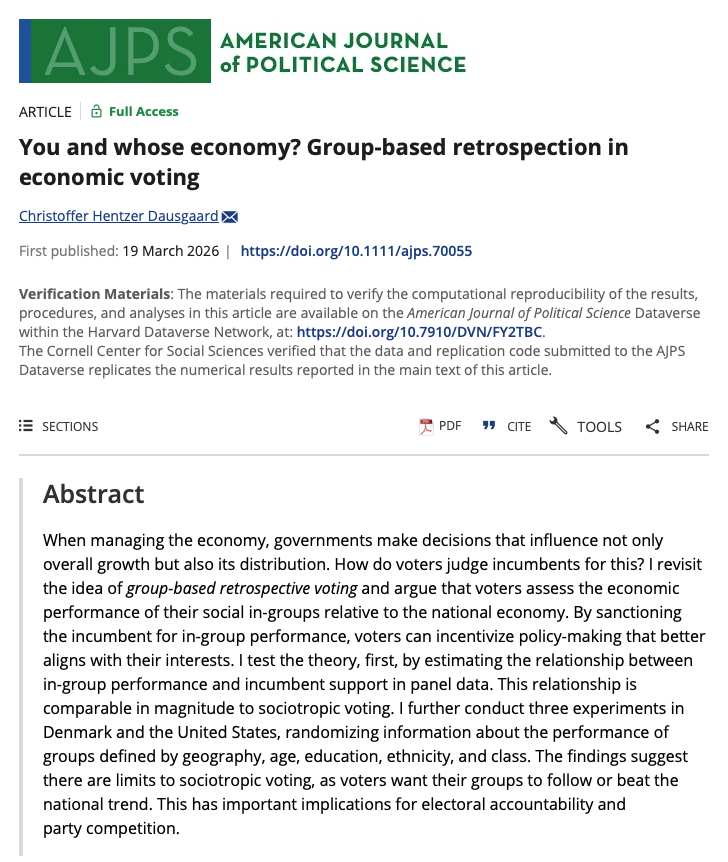
Very excited that the first paper of my PhD is out in @AJPS_Editor! 🎉
I theorize and test the idea of "group-based" economic voting using experimental + observational evidence from Denmark + UK + US.
1/🧵
New version of "Power Rules" just posted.
This version has been accepted at Political Analysis.
OSF Preprint: https://t.co/RUoKsTTa5G
HTML version w/ R code: https://t.co/iOG3CVgIgv
GitHub: https://t.co/wu5nd4Iqjd
Despite voters listing costs & the economy as top concerns, some factors point against interpreting as an economic fundamentals election:
1) economic factors aren't strongly related to midterm outcomes
2) objective economic statistics are mixed & not predictive of a wipeout
Nobody told me about the post-election causal inference rumspringa. We’re out here fitting garbage can regressions and interpreting coefficients as causal effects like it’s 1995.
Did counties where gas prices hit harder swing further against the Republicans than similar neighbors?
My pre-registered test, filed the day before the midterms, finds no sign of this. That's not to say that gas prices didn't matter, but it sheds some light on the mechanism.
🧵
How will high gas prices affect the midterms?
It's an important question but hard to answer empirically. I've written down a plan to test part of it, and I'll publish my first results on Thursday, when most of the vote is in. 1/🧵
https://t.co/QeaRIZsTrw
How will high gas prices affect the midterms?
It's an important question but hard to answer empirically. I've written down a plan to test part of it, and I'll publish my first results on Thursday, when most of the vote is in. 1/🧵
https://t.co/QeaRIZsTrw
This is very neat and the author is careful to note that the design is susceptible to a version of the missing intercept problem, but I think the conclusion that there was no "pocketbook voting" is unwarranted and this will predictably be misinterpreted as showing that gas prices didn't affect the midterms, which it doesn't.
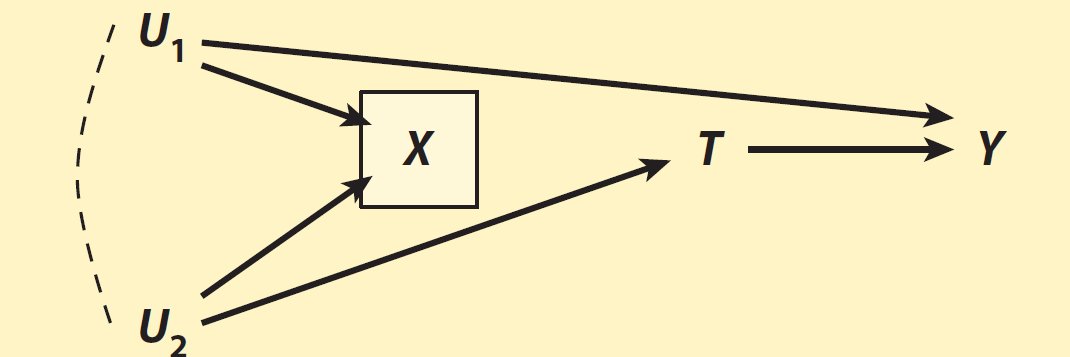
What it shows is that, once everyone was "treated" by a huge gas price increase as a result of the war (more than $1 per gallon on average at the national level), it was impossible to detect any association between small variations in price among nearby, similar places and the swing against Republicans, which is the variation that was used to estimate the effect so it could plausibly be interpreted as causal. This variation is tiny relative to the national rise in price though. I asked ChatGPT to compute the mean absolute deviation for those comparisons and it's about 6¢ per gallon on average.
Again, the author is careful to note that such a result doesn't rule out the possibility that people voted on the national price increase, but interpret the result as showing that in that case this vote would have been "sociotropic" and not a case of "pocketbook voting". In order words, people may still have swung against Republicans in reaction to what they saw as a deterioration of the national economy, but they didn't do so in response to the deterioration of their own financial situation.
However, this assumes that the effect of a price increase on the swing against Republicans is linear, which strikes me as highly dubious. I think it's more likely that, once everyone has been "treated" with the massive national price increase, a few more or less cents per gallon due to local idiosyncratic factors don't make much of a difference because people are already pissed. I certainly wouldn't expect the proportional effect to be constant.
To be clear, even if the swing against Republicans had been a "sociotropic" response to the national price increase, the Republican wipeout would still have been caused by the gas price increase resulting from the war. (Of course you may simply deny that it had anything to do with gas prices, whether "sociotropically" or "pocketbookally", but then I really don't know what to tell you.) I just don't think we can rule out pocketbook voting based on those results, nor do I think it's likely that pocketbook voting didn't matter.
Finally, it may be worth noting that, even if we assume linearity, the results of this analysis seem consistent with a meaningful swing against Republicans motivated by pocketbook reasons. Indeed, if we take the 73 gallons per household per month average consumption used by the author for illustrative purposes, a 0.3 point per $10 of fuel cost increase would still imply a ~2.2 points swing against Republicans caused by fuel cost increases. I haven't bothered tried to simulate what this could have changed in each place using real exposure, but I suspect it could still explain a meaningful part of the wipeout, though again I don't think we should assume linearity anyway.
@phl43 Thanks! I agree on all this. In hindsight, I shouldn’t have mentioned sociotropic voting because I think it caused confusion. My point was not to exclude PB voting as such, but PB voting “in its simplest form” (linear, as you note). Some PB voting still likely imo.
@marcomavina@hannohilbig Yeah I agree, I'd also want to look into other analyses I could supplement it with if I were to publish. A survey experiment like that would be one option!
I'm still skeptical of how people will read this. I know you say this doesn't tell us how many votes the rise cost Republicans, but my concern is that people will take the thread as evidence that gas prices mattered much less than they thought. They see a study that looks at gas prices, they see the words "robust null," and then they update. I don't think the study can tell us that.
On the variation, your site says that about 4% of the differences in extra fuel costs between counties remain in your research design, and that half of markets are within about $3.30 a month of their group's average. The cost everyone shared was about $79 a month, so applying your result to the national rise means going far beyond the differences you use.
Further, even if each dollar counts the same, your 0.3-per-$10 bound still allows about 2.4 points against Republicans at $79 a month. Also, and this is of course difficult to test, I don't think each dollar counts the same. Gas prices have long differed across places and also move across seasons, so people are used to small differences anyway.
You mentioned that voters may not notice a few dollars at the pump. In this case, we should probably say a few cents a gallon, because that's what they are looking at, but they're probably way more likely to notice a rise of more than $1 per gallon.
Overall, I think it's a great effort, but to me, it seems like an uninformative null for the pocketbook effect of the national rise. The issue is that people could weigh it way too heavily as evidence against an effect of the national rise, which it, in my opinion, does not constitute at all.
Lately I’ve been thinking about how a variable might influence macro outcomes without local variation in that variable explaining local variation in the outcome. This is a challenge for researchers (including myself) who use, e.g, county panel data to study big political changes
@hannohilbig@prhjohnston Basically, it can exclude a relatively specific mechanism above a certain size! "Robust null" was shorthand for the local estimate; it might have sent the wrong signal.
@hannohilbig To @prhjohnston's point, this is basically the missing intercept problem, not trivial here (as in many places). I was very motivated to explain these subtleties when I built the site, so it shows in detail how little of the variation the design uses and which gaps it compares.