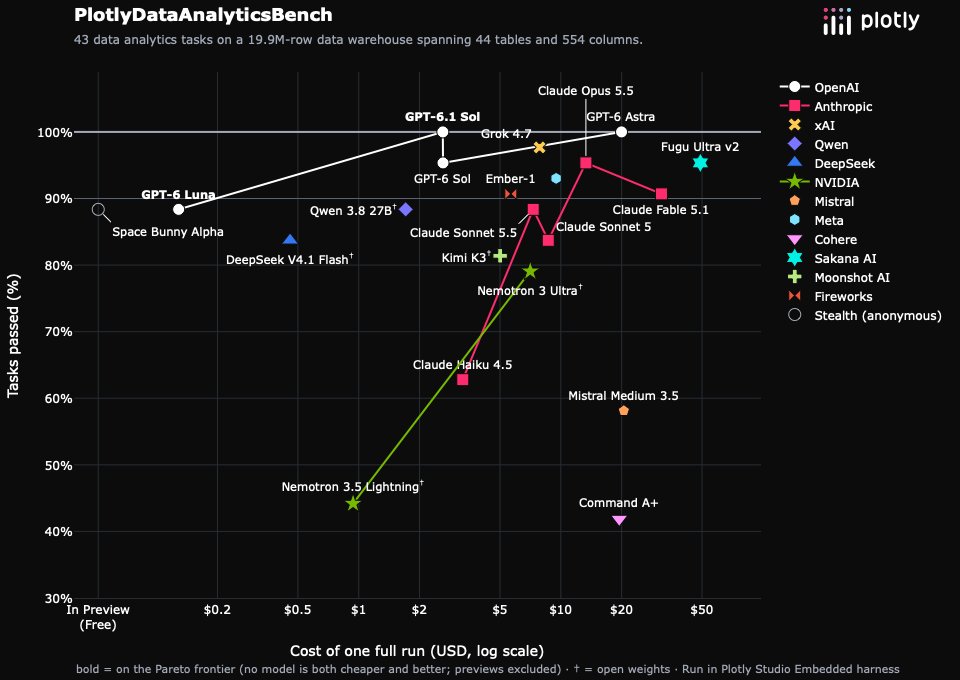
GPT-6.1 Sol is the second model to get a 100% on our data analytics benchmark. The first was Astra 3 weeks ago.
GPT-6.1 Sol finishes the exam about 53% faster and does it at 10% of the cost.
This is a very solid model for data analytics and visualization.
Plotly.js 4.0 is out! 🥳
New trace type, many more customization options, lots of bug fixes, and a few low-key, strictly-better changes to the defaults. See the full release notes and examples here: https://t.co/kdm1iR5LZg.
It's launch day! Introducing Plotly Studio Embedded 🥳
Plotly Studio Embedded brings agentic analytics directly into your Dash app. It enables the viewers of your application to ask questions about data and generate charts, tables, maps and reports with AI.
There's a few things that make this product really unique:
1. Configuration as code: Data access is managed in code in advance, so end users don't need to fuss around with connectors or credentials themselves.
2. Data is front-and-center: Most AI chat experiences show you a wall of text. That's not what we think data analytics should feel like. Plotly Studio Embedded is designed to show you the queries, graphs, and tables every step of the way.
3. Secure: Rather than engineering an agent that can do anything (including escape sandboxes), we engineered this agent to only perform data analytics and visualization tasks. There's no arbitrary code execution, no network access, no filesystem access.
4. Embedded: The AI experiences co-exists alongside predefined views. So end users can have the best of both worlds and so that you can save on token$ by placing the common charts and tables in the Dash app itself.
Read more: https://t.co/DUKKxNy78C
Join the launch event: https://t.co/Ec6BnnubuD
🌟 Announcing https://t.co/QXafzjjSCp 3.0.0 🌟
1 year in the making, this is our biggest release yet:
- Deep Jupyter widgets integration
- Interactive plotting of >1M points in Jupyter 🚀
- 1st-class JupyterLab support
Plus much more! Read how we did it: https://t.co/yQRuj3J5iL
Plotly is HIRING!
Junior + senior dev ops positions for our Montréal office. Deep Linux, bash, and Docker experience required. 🐳 🇨🇦
Please RT
https://t.co/3mOpJMr9Yp
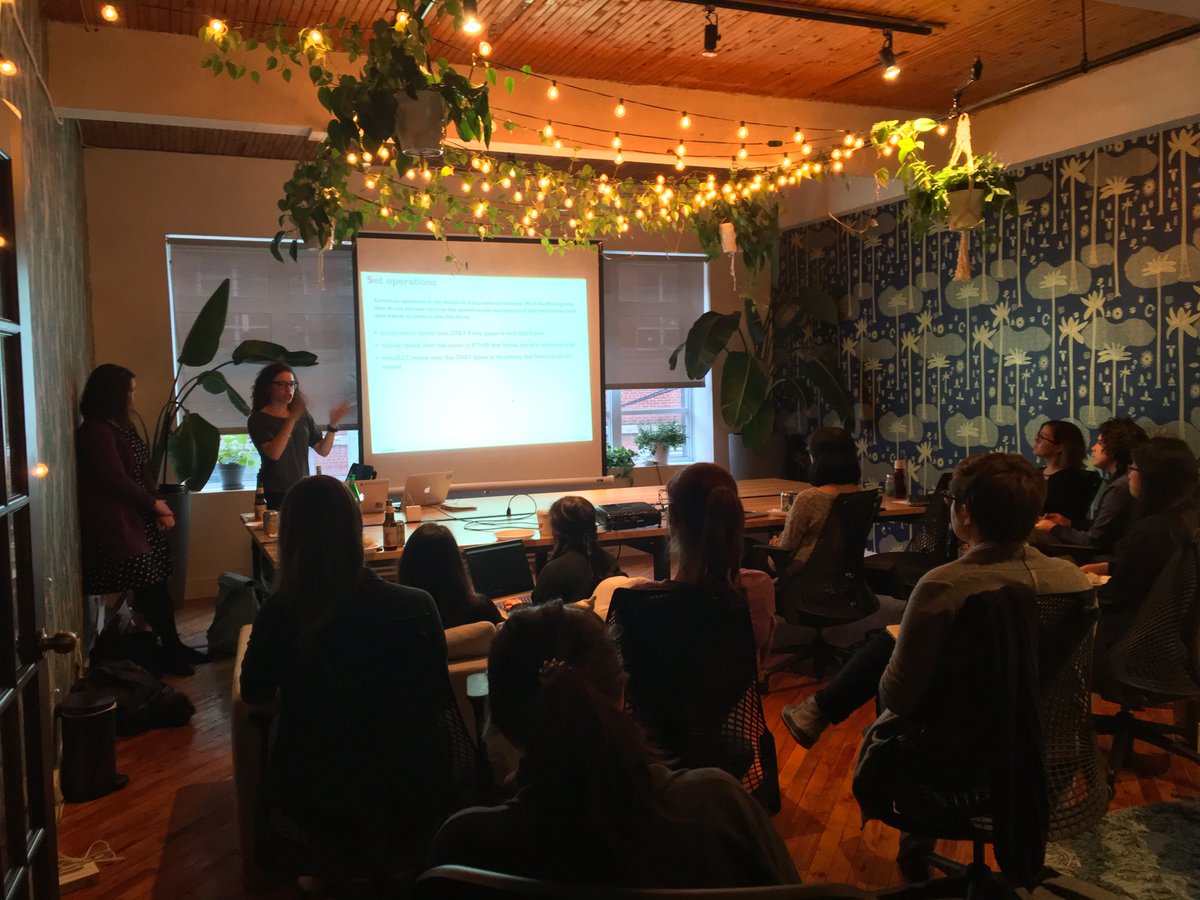
Thank you to all the @RLadiesMTLkickoff attendees, @plotlygraphs for sharing your space and @prec_analytics for the 🍕'za 🍕! Can't wait for the next one on April 19 🗓️
Seats still available for April Boston workshops. Level up your data science CV with Dash, R/Shiny, and Jupyter 📓 skills:
https://t.co/dTOm5eJSC6
- Dash workshop via @chriddyp
- R/Shiny viz via @cpsievert
- Intro to DS in Jupyter via @spencer_lyon
Produced by @formulatedby
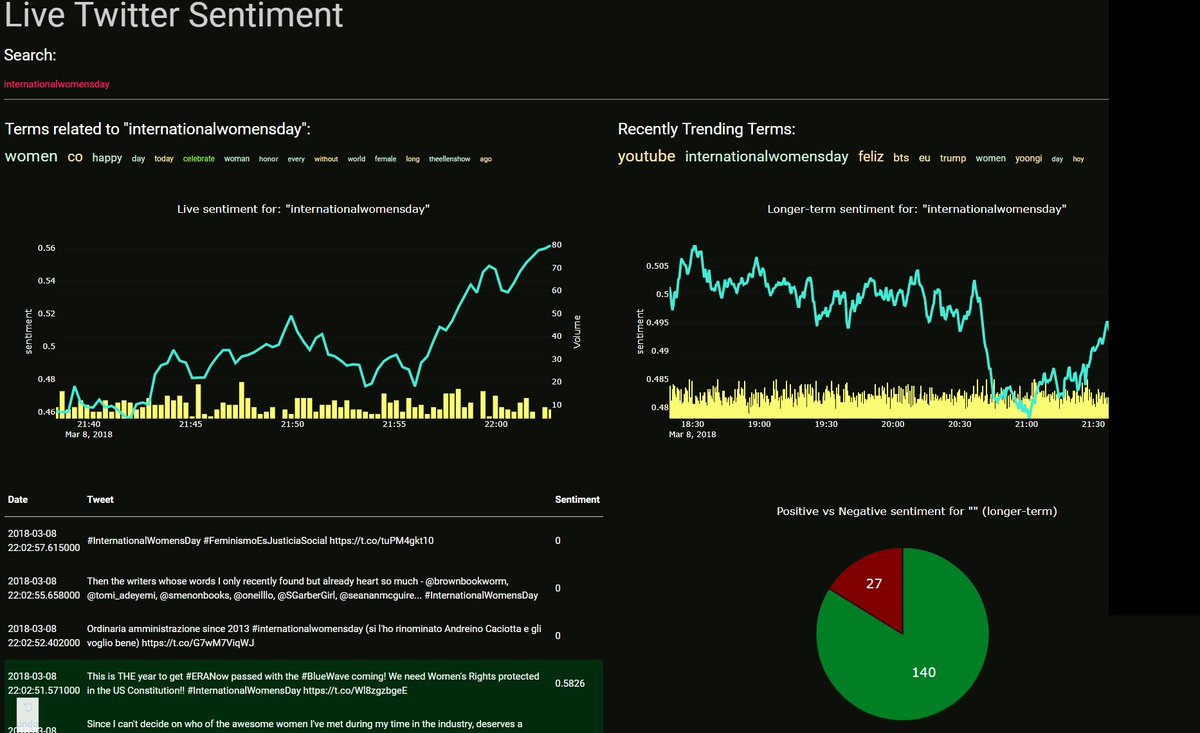
Work in progress, could break at any moment: http://159.65.90.85/
Type in the search whatever term you're interested in. Made with #Python and #Plotly's #Dash framework.
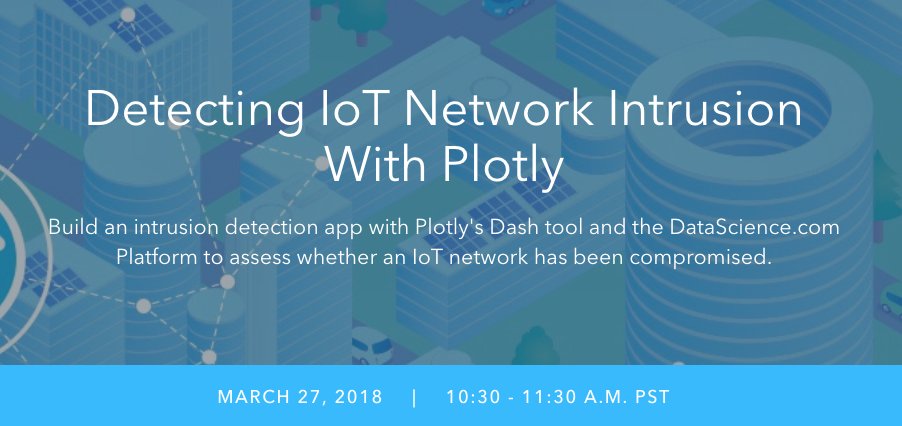
Want to learn how to up your @plotlygraphs game from one of its cofounders? We're hosting a webinar on 3/27 to demonstrate how to build network intrusion detection apps using #IoT data. Register now: https://t.co/4UbYrSrN1K @chriddyp#machinelearning#webinar
ICYMI: New polar & radar charts for Python, R and JS 🕸
Py: https://t.co/WcloYMrGDp
R: https://t.co/qeztteQxge
JS: https://t.co/vadXmom7uj
Rotate, hover, axis drag, and radial zoom. Both D3 & WebGL options.
#JupyterLab#rstats#rstudio#D3js
What a day! Day 2 was more than amazing, @chriddyp knowledge and teaching skills were beyond my expectations. Highly recommend Dash masterclass! Thanks for everything @plotlygraphs