All open source, MIT licensed.
Website: https://t.co/INGYL2QeLS
GitHub: https://t.co/2F4p0Xn3fU
Built for researchers, foresters, and anyone working with US forest data. Feedback welcome!
Click "Post all" to publish the thread.
askFIA: Ask questions in plain English
"How much timber volume is in North Carolina?"
AI-powered interface to FIA data. No SQL required.
https://t.co/awWnEGoxyI
pyFVS: Forest growth simulation
Python implementation of the Forest Vegetation Simulator. Model stand dynamics for southern pines.
pip install pyfvs-fia
https://t.co/mVmDs8k0lr
pyFIA: Query USDA Forest Service data programmatically
No more EVALIDator web forms. Get timber volume, biomass, and carbon estimates with Python.
pip install pyfia
https://t.co/7pFogcpzZi
@exconomist@LudoGazze This would be my approach, unfortunately it would take quite a bit of processing. I’ve done it for calculating my own heating/cooling degree days metrics , but don’t know of a public source for this sort of measure. Feel free to reach out for more details.
Tree planting is widely popular w/ programs from the Sahel to South Korea – but can it lead to *local* climate change?
@florian_grosset@ctaylor463 and I study this in a new WP "Rain follows the forest: Land use policy, climate change, and adaptation" https://t.co/cqHDCFfgYG 1/8
@MeganKonar I started grad school wanting to pursue water economics but the data just wasn’t there for the questions I had. Makes me happy that this kind of resource is there for today’s young researchers!
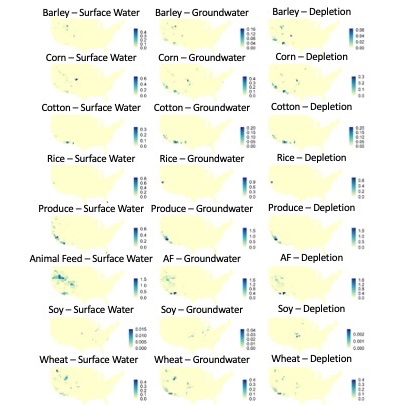
How much water does each crop use?
We estimate irrigation for each crop in the United States, by county, year, & water source.
Our database of ~2.5 million data points is freely available.
Paper (open access): https://t.co/gwkhGOwPOq
Data: https://t.co/q8f7cTf2wU
More than 61 million people consume water from the eastern region's forested watersheds - and the majority of those forests are owned by individuals & families! Raise a glass to our family forest owners! #cheers#NationalWaterQualityMonth
Many people new to machine learning have no idea that labeling data is a problem they need to think about.
To be clear: "labeled datasets" aren't a thing in the real world.
Here is an excellent approach to getting past this problem:
1 of 11
Here is my #viz for the #TidyTuesday challenge - week 24. This one is about the historical drought conditions (1895 – 2022) in the U.S. contiguous.
.
📝: https://t.co/29bfXYg9mR
.
#rstats | #r4ds | #tidyverse | #dataviz | #learning
Another publication alert. Our paper with @nphendricks about the use of CRP to sequester carbon is out in Agricultural Economics. https://t.co/C23FIGox3s
You can read the free ebook "Fundamentals of Data Visualization" by Claus O. Wilke on #dataviz with #rstats on the following website of the named author:
https://t.co/VzxjCS9dir
Healthy forests don’t happen by chance.
The 176 million acres of forest in the Northeast & Midwest provide clean water, wildlife habitat, recreation, jobs, forest products & carbon storage.
Read about how we are working together to ensure these benefits
https://t.co/zXeIL56dzx
For millennia, humans have used more and more land for agriculture, taking over wild habitats.
But, we are at a unique point in history: agricultural land use has peaked.
My latest article:
https://t.co/2zWVptZ3Gj
The pandemic triggered a worker shortage in many areas. A @usfs_srs scientist explains how the pandemic limited the availability of wood products, such as softwood lumber & structural panels used to build homes. https://t.co/4hPzOVhEei 📷 Licensed Getty image