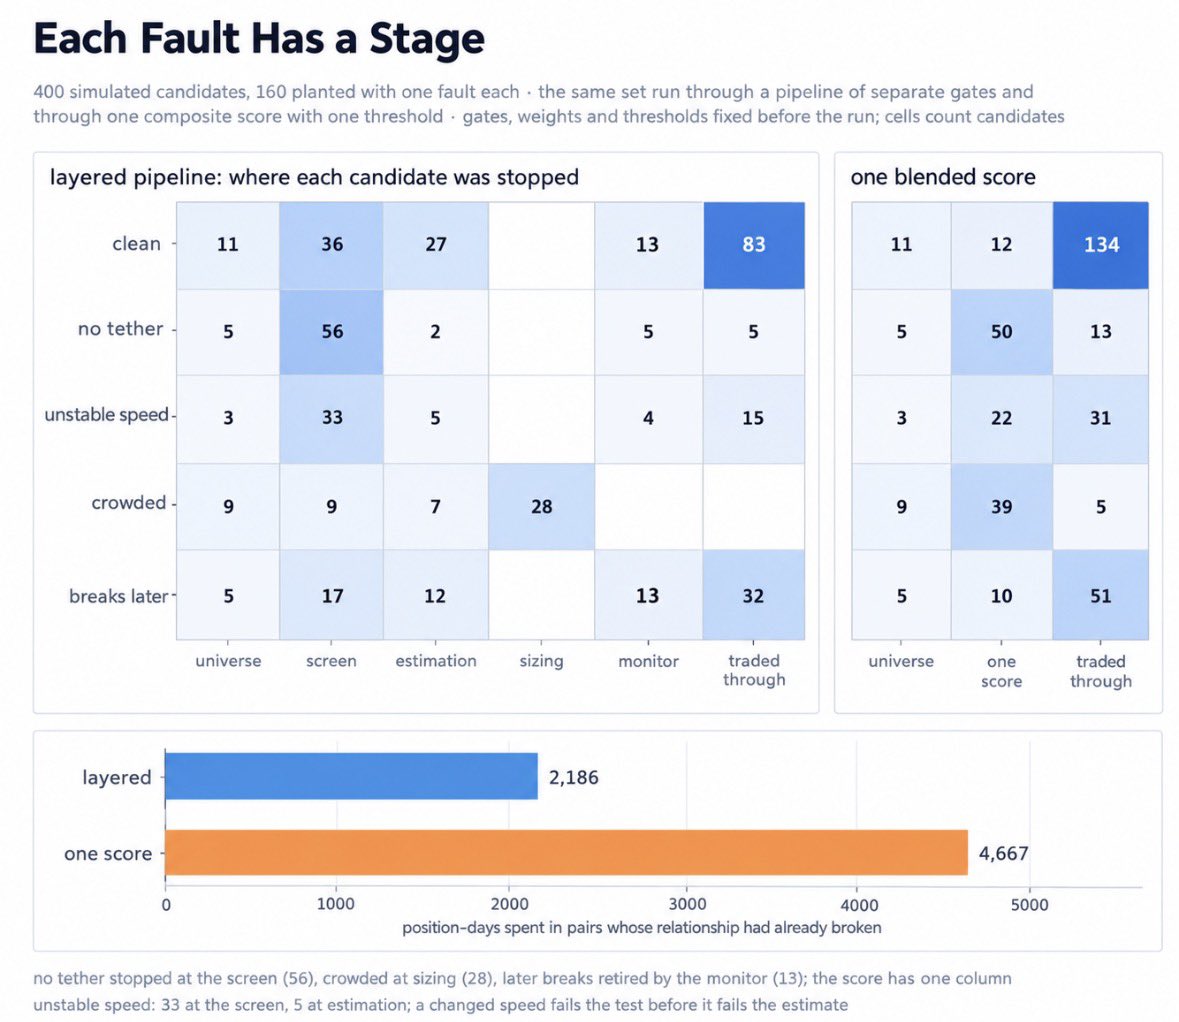
A pairs strategy is a sequence of decisions, and any one of them can reject a candidate before it becomes a position. The discipline sits in the order and the thresholds. No single model supplies it.
The pipeline goes like this. Define a universe restricted by liquidity and by some structural reason the names should co-move. Screen for cointegration under false-discovery control. Estimate the hedge ratio, the half-life, and the spread volatility. Size to capacity, to the reversion budget, and to risk contribution. Monitor with a break-detection layer. Exit on a rule written in advance. Every stage is a filter. A candidate that clears selection can still be thrown out at sizing, and one that trades can still be retired by the monitor. Because the stages are separable, a rejection at one gets caught there instead of compounding downstream.
That separation is what localizes a problem. A poor hedge ratio is an estimation-stage problem. A crowded position is a sizing-stage problem. A broken relationship belongs to the monitor. Keeping them apart means each gets tested against its own criterion instead of being blurred into a single score.
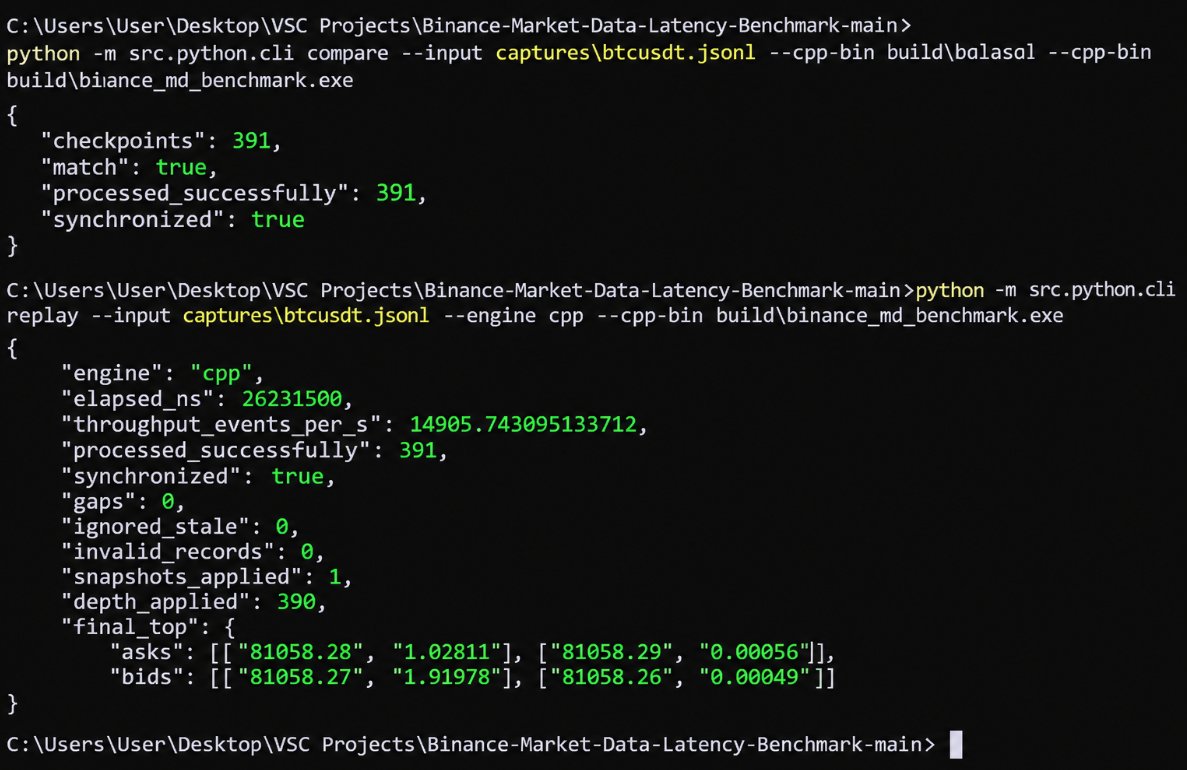
Data latency benchmark in C++ and Python.
Depth updates and trade events over WebSockets, synchronises the local order book against a REST snapshot, and applies Binance’s update-ID rules to detect sequence gaps and stale events.
Captured events are persisted for deterministic replay through both implementations. The benchmark records decoding, snapshot application, depth-update, event-processing and top-N extraction timings, alongside synchronisation and data-integrity metrics.
https://t.co/OnBJuGjgln
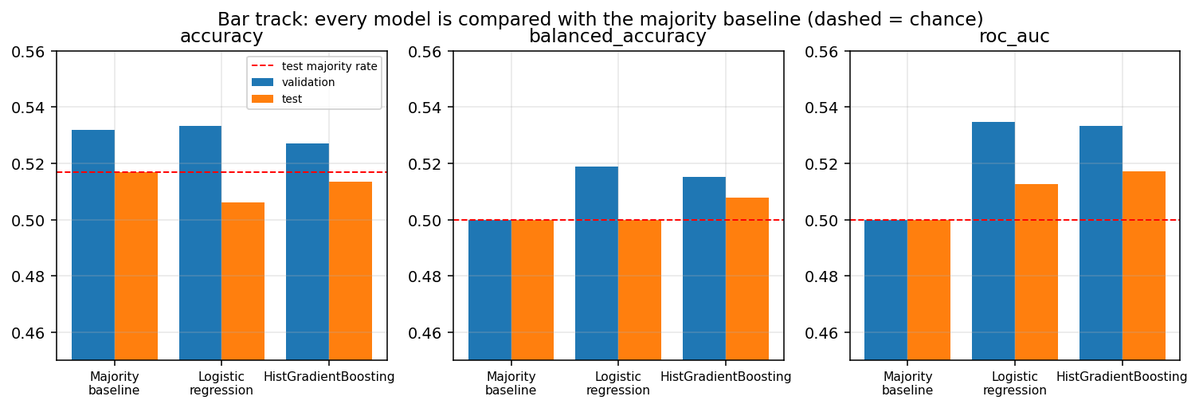
For the 1-minute bar study, I compared logistic regression and gradient boosting against a majority-class baseline.
The evaluation uses a chronological test set and five-fold walk-forward analysis. The aim is to distinguish repeatable directional information from patterns that don't generalise out of sample.
Full code and methodology: https://t.co/w4BvwH1wDn
Worked on a research pipeline to study short-horizon BTCUSDT price prediction using Binance USD-M futures data.
The study covers 1-minute candles and live order-book snapshots, with chronological validation, leakage controls and baseline comparisons.
The order-book track examines whether depth, imbalance and related features contain information about the mid-price one second ahead.
I tested logistic regression, an FNN and a GRU. The initial capture is too short to support a reliable conclusion, so collecting more data across market regimes is the next step.
Forgot the most important we have encountered.
Most fund investors come via private banks. These banks invest in funds for their clients via omnibus account( means funds don't know details of the investors behind the account except that there is comfort that money coming via banking channel is kosher and necessary AML checks etc have been done by the banķs)
So who is supposed to check who is a foreigner and who is an NRI and if he is a foreigner does he have OCI card or not. Banks check citizenship details when opening account but they don't ask these foreigners whether they are OCIs also.
How to do this compliance- no one knows and therefore private banks don't even register funds unless large capacity is available due to very large institutional foreign money in the fund already which allows capacity for NRIs/OCIs.
Data latency benchmark in C++ and Python.
Depth updates and trade events over WebSockets, synchronises the local order book against a REST snapshot, and applies Binance’s update-ID rules to detect sequence gaps and stale events.
Captured events are persisted for deterministic replay through both implementations. The benchmark records decoding, snapshot application, depth-update, event-processing and top-N extraction timings, alongside synchronisation and data-integrity metrics.
https://t.co/OnBJuGjgln
Brazil’s equity market has often traded at a discount to other emerging markets.
Those gains can reverse if the runoff outlook shifts or if fiscal plans remain unclear after 25 October; Brazil’s public debt trajectory and the level of interest rates remain structural constraints regardless of the election outcome.
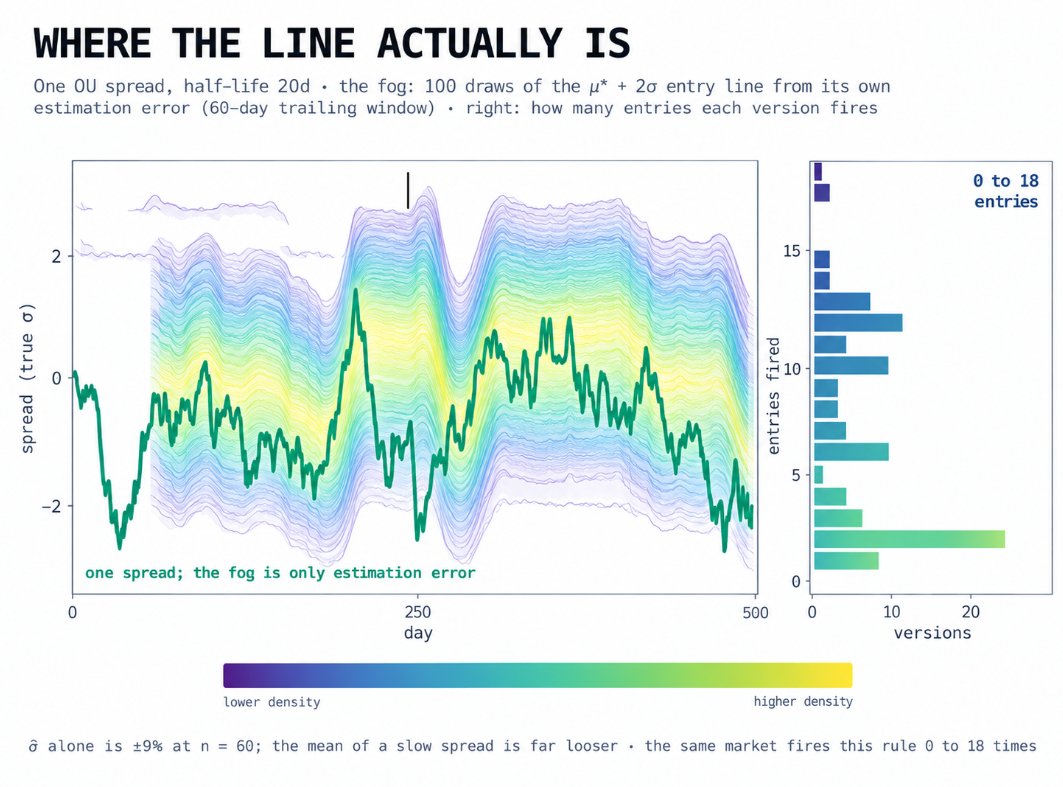
A spread traded at z = 2 is traded two sigma-hats above mu-hat, and both are estimates with their own error. The entry threshold is not a fixed level. It moves with the estimate.
Standardizing as z = (spread − μ̂)/σ̂ needs a mean and a standard deviation, and the window that supplies them decides what the backtest is worth. Full-sample estimates use data from after the signal date, so look-ahead goes straight into the result. Trailing windows avoid that and pay for it in sampling error. From n observations the sigma estimate has a relative standard error near 1/√(2n), which on a 60-day window pins it to about plus or minus nine percent. Nine percent is the floor, for independent draws. At the persistence a traded spread actually has, the error runs several times wider, and the estimate comes in low besides, since the window mean absorbs part of the spread's wander. A sigma ten percent high turns a nominal z = 2 entry into a real 2.2 sigma entry, and the trade frequency shifts with it.
The mean is the weaker of the two. Pinning it down needs a span long relative to the half-life, so on a slow spread the level itself is poorly identified, and every z-score computed against it inherits that error whole.
So the mean and sigma come from a trailing window that ends before the signal date and is sized to a multiple of the half-life, and the entry threshold is treated as an interval with its own error rather than a line.
“Remember Devin? It works now.”
After the internet said it wouldn’t, Cognition put that on a billboard.
The @cognition story with @ScottWu46 and @aaref.
The big news last week was of course the sharp drawdown in high yield data center bonds and what that might mean for the broader AI buildout. I have been eyeing the price analog between the AI boom today and the internet boom-turned-bust in 1998-2000 and have been comforted by the fact that earnings are so strong today that equity valuations are falling instead of rising. We can see that below. 🧵(1/3)
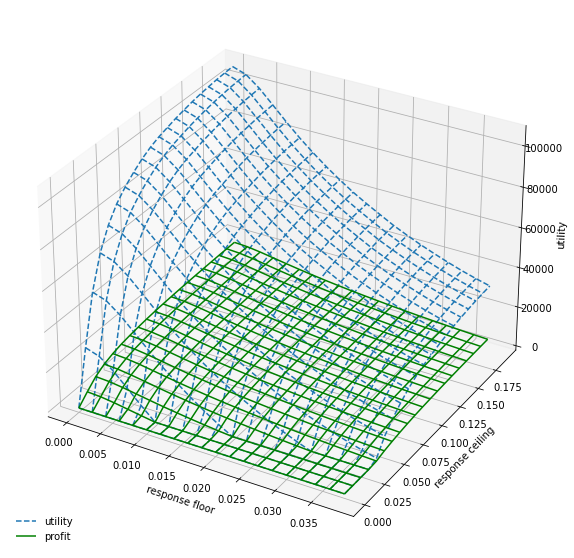
Profitability alone isn’t enough to achieve a high utility score; consistency matters just as much, with bad trading days penalized heavily.
The plot shows the utility score across floor and ceiling thresholds for selected opportunity responses over the first year of training data.
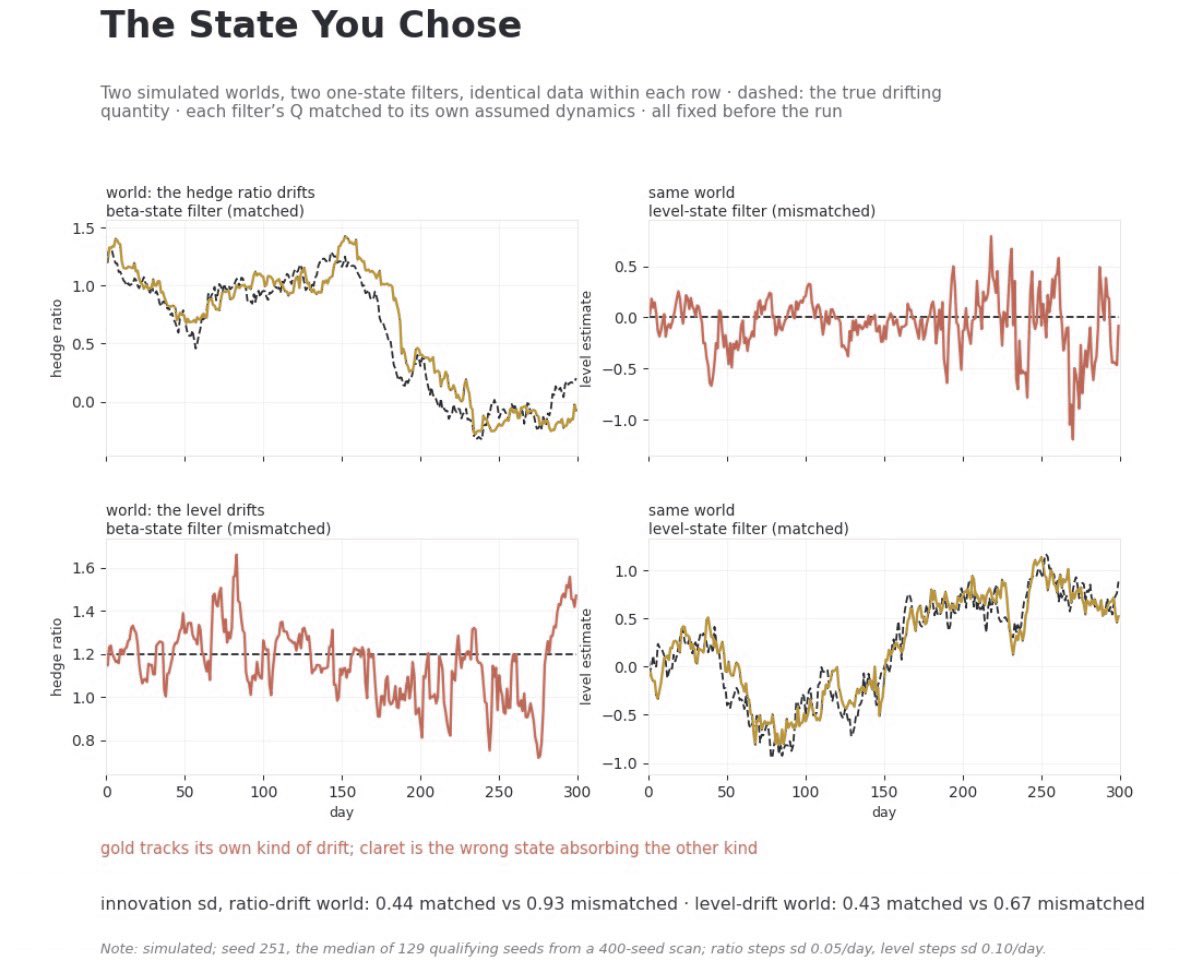
A state-space model is not only a smoother. It is a statement about what can vary over time, so choosing between a state vector [βₜ], [αₜ, βₜ], or a richer form that includes latent spread level, volatility, or a regime indicator changes the economic reading of the pair before any trade is placed.
Let βₜ move while forcing αₜ = 0 and every slow location shift gets pushed into the residual. Let both αₜ and βₜ wander freely and some structural breaks are absorbed as gradual parameter drift, which reduces visible stress in the spread while weakening what equilibrium means.
Speaking about "the Kalman filter" as though it were one object hides that choice. Two filters with identical Q/R values but different state definitions produce different notions of deviation, half-life, and break behavior.
If a strategy makes money, someone is losing it, and I should be able to say who they are and why they keep coming back. They might be hedgers paying for insurance, or funds forced to sell. For instance, in crypto options, the counterparty is sometimes easy to name. Yield vaults sell calls on a fixed schedule, whatever the price, and that predictability is worth something to whoever trades against them. If I can’t name the loser, the likeliest explanation is that I am being paid for a risk I haven’t found yet.
Semiconductors have declined for eight straight sessions, longest streak in 16 years (index is still up >50% YTD)
[Past performance is no guarantee of future results.]
I firmly believe Renaissance’s success was partly driven by Jim Simons hiring people from diverse backgrounds.
The ultimate quant skill is connecting ideas across disciplines, using mathematics to build a framework around an economic story, and translating it into a trading strategy.
The best quants aren’t necessarily the best mathematicians or economists. They’re the ones who can move rigorously between the two and prove that their insights have an edge in real markets.