Week 4 Class 1 Data Analytics Class by @TechSphereAcad with @ezekiel_aleke
This class was more of a deeper dive into the power of power query (no pun intended🌚). We unpacked a lot more, most especially for me the "Add Column" tab properly:
- Custom Column
- Conditional Column
- Index, Format, Extract... all of it
- Real examples + Q&A
The simplicity of cleaning complex data (i call it clicks with less formulas), time saving and faster data preparation, access to multiple data sources shows power query stands out
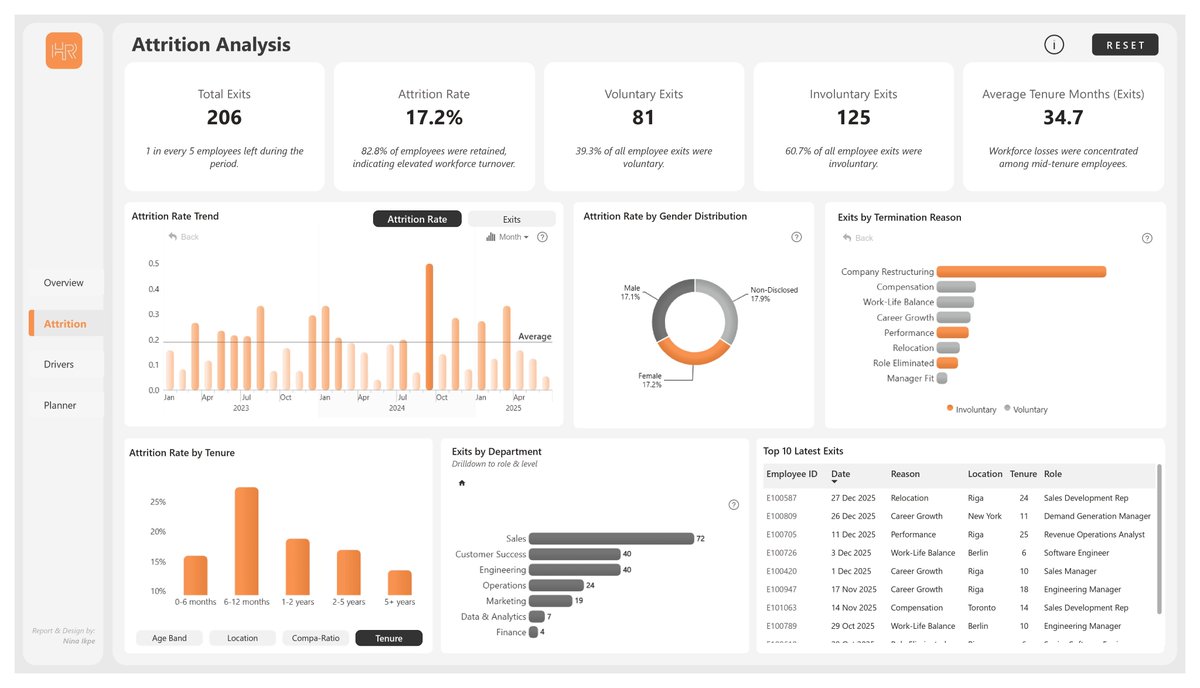
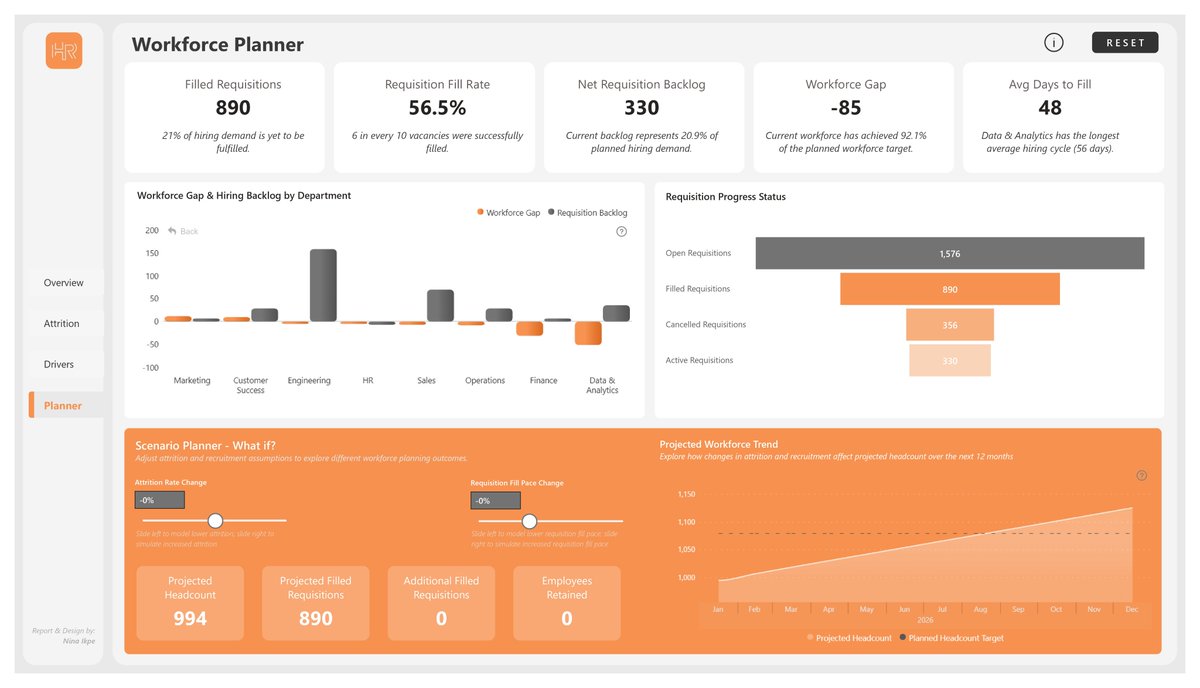
Built a Workforce Planning Analytics dashboard in Power BI.
It brings together workforce, attrition, retention, & recruitment insights, plus an interactive Workforce Planner that helps HR leaders simulate hiring & attrition scenarios to support future staffing decisions.
Back to my LMS for Week 3 Class 2 Data Analytics class (Hajime Cohort) by @TechSphereAcad with @ezekiel_aleke
Kicking off with the prompt on POWER QUERY which briefly introduces what tool power query is, how it can be used to clean and transform, import data
view on the fact that DATA IS EVERYWHERE and Excel is super technical and proficient...
This tool help to make complex data cleaning process faster and easy, allows for multiple tables to be cleaned and transformed in an organized way for further analysis and visualization.
MY FIRST Excel Dashboard 🎉
Built from our little data analysts WhatsApp group dataset. I gave a few insights on Top skills, Skill levels, Group gaps
I used tools like PivotTables, Slicers, Charts, Conditional Formatting and functions.
Here is what i built..