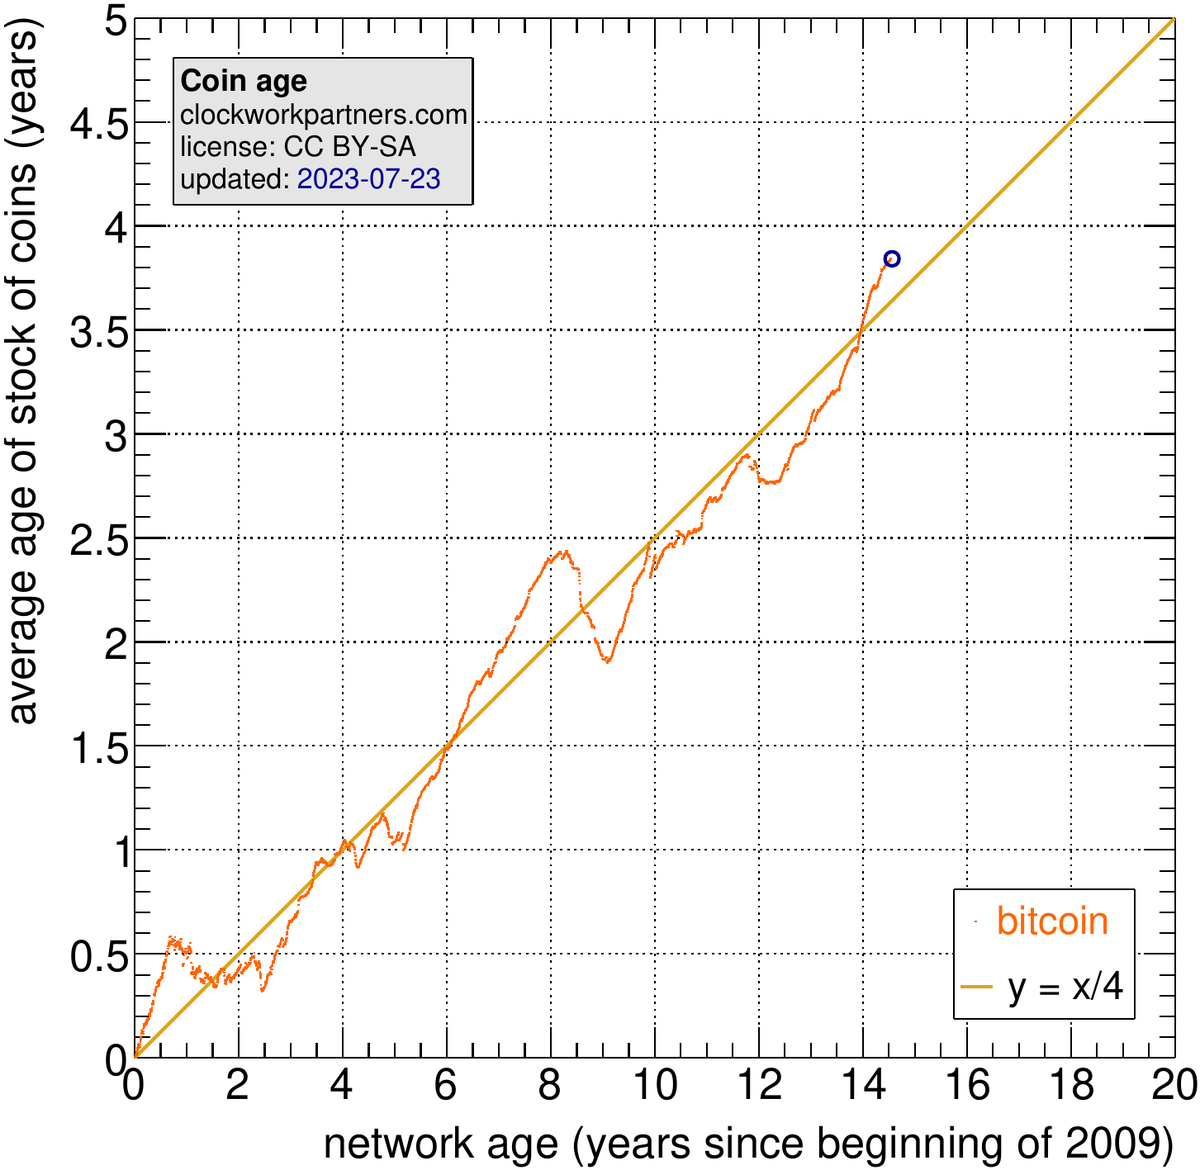
1. the average age of the stock of bitcoin has grown in proportion to the age of the bitcoin network. this suggests using a relative lookback period rather than a fixed (absolute) period.
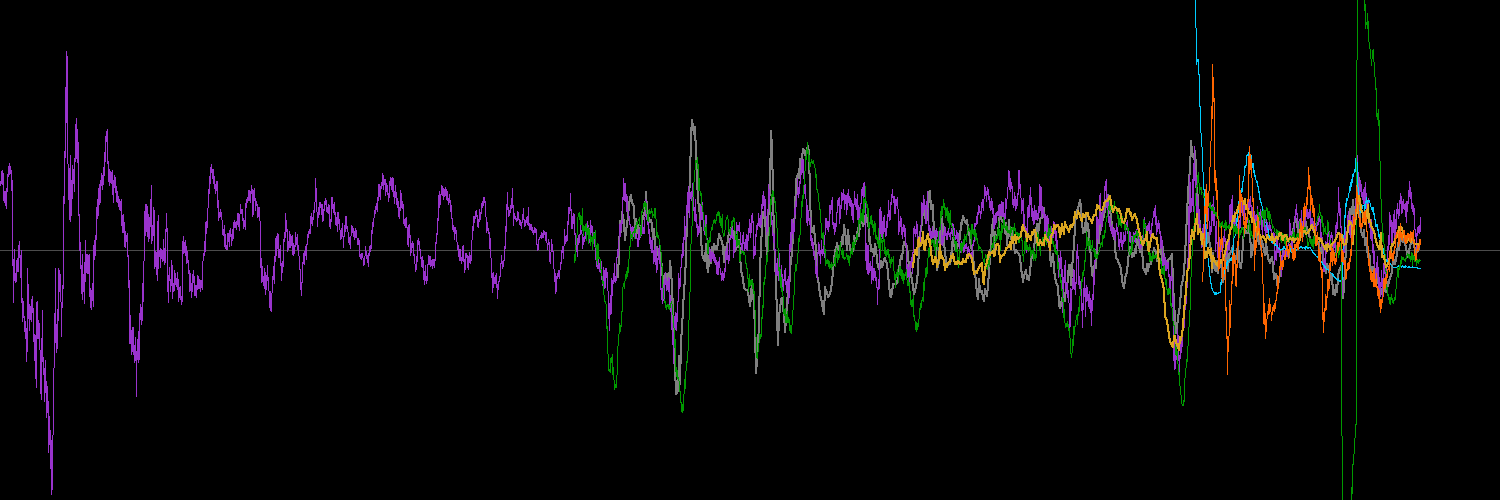
to visualize bitcoin's cyclicality alongside other data, back out its power-law growth.
a year-over-year example (date, bitcoin network age, price):
2021-11-21, 12.9 yr, $59.0k
2022-11-20, 13.9 yr, $16.2k
($16.2k / $59.0k)^(1/6) * (12.9yr / 13.9yr) = 0.75 YoY
and chart:
to visualize bitcoin's cyclicality alongside other data, back out its power-law growth.
a year-over-year example (date, bitcoin network age, price):
2021-11-21, 12.9 yr, $59.0k
2022-11-20, 13.9 yr, $16.2k
($16.2k / $59.0k)^(1/6) * (12.9yr / 13.9yr) = 0.75 YoY
and chart:
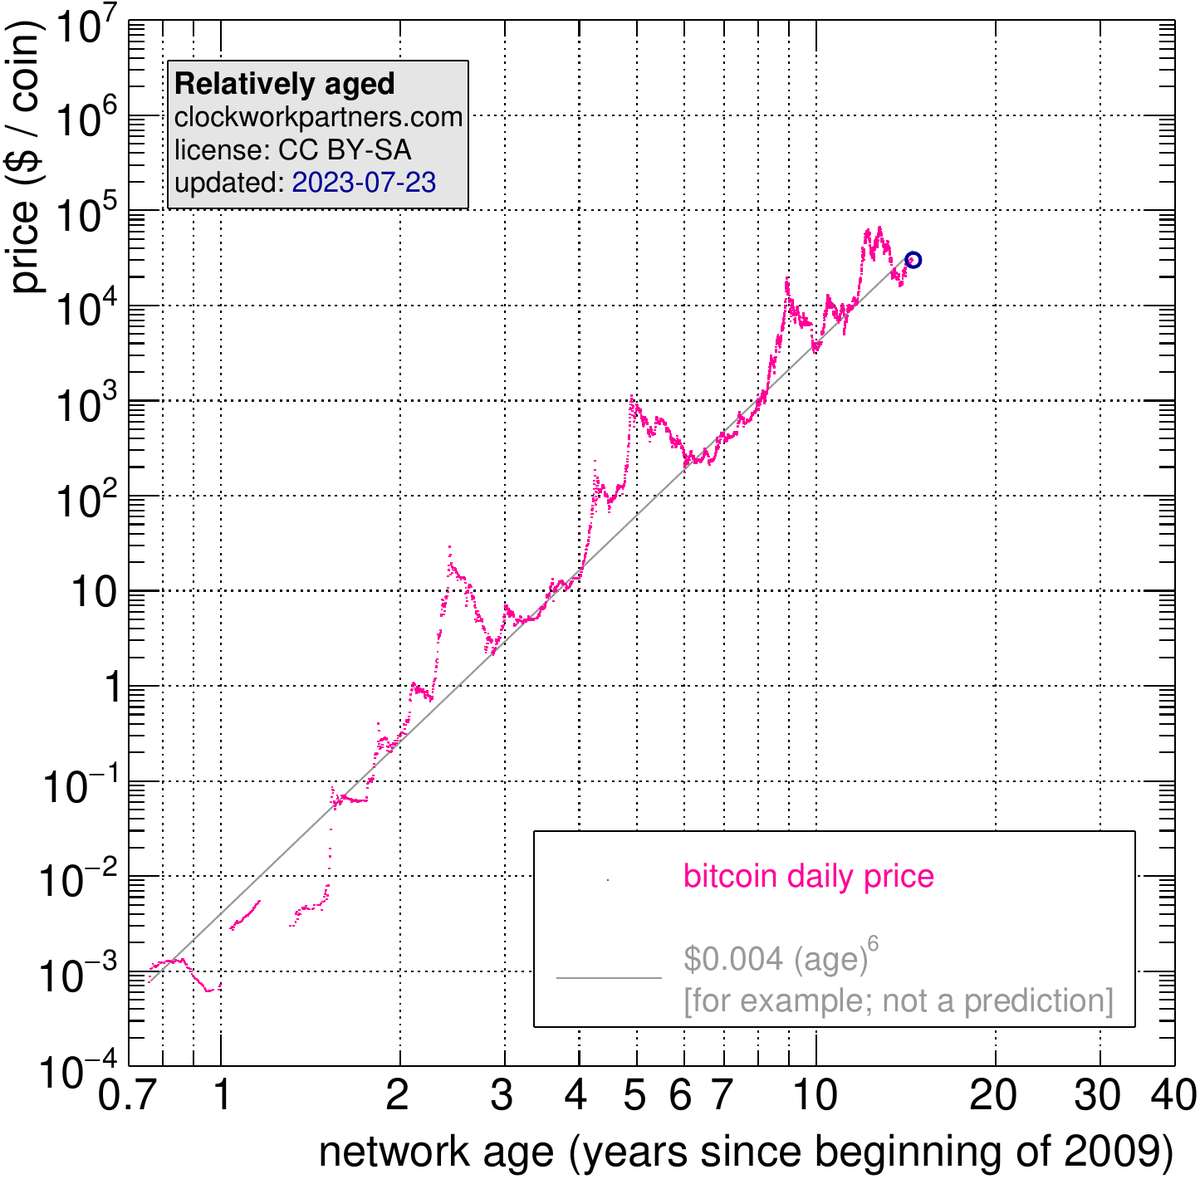
3. the above suggest considering the age of the bitcoin network as multiplicative rather than additive, i.e. using a logarithmic axis. the gray line illustrates power-law growth using round-number parameter values.
@_Checkmatey_ ty. interesting that hodling seems to set the relative timescale. will the average coin age continue to increase in proportion to the network age? who knows, but if so, this framing may hold up.
1. the average age of the stock of bitcoin has grown in proportion to the age of the bitcoin network. this suggests using a relative lookback period rather than a fixed (absolute) period.
8. these charts are intended to frame bitcoin's growth rather than to support making precise predictions. let's see how well this approach frames bitcoin's growth over the next few years. see detailed descriptions at https://t.co/y8V6R4wmEs
@wordspeakingman@saifedean 2020-03-11 end of day (UTC) price: $7.94k
2020-03-12 end of day (UTC) price: $4.96k
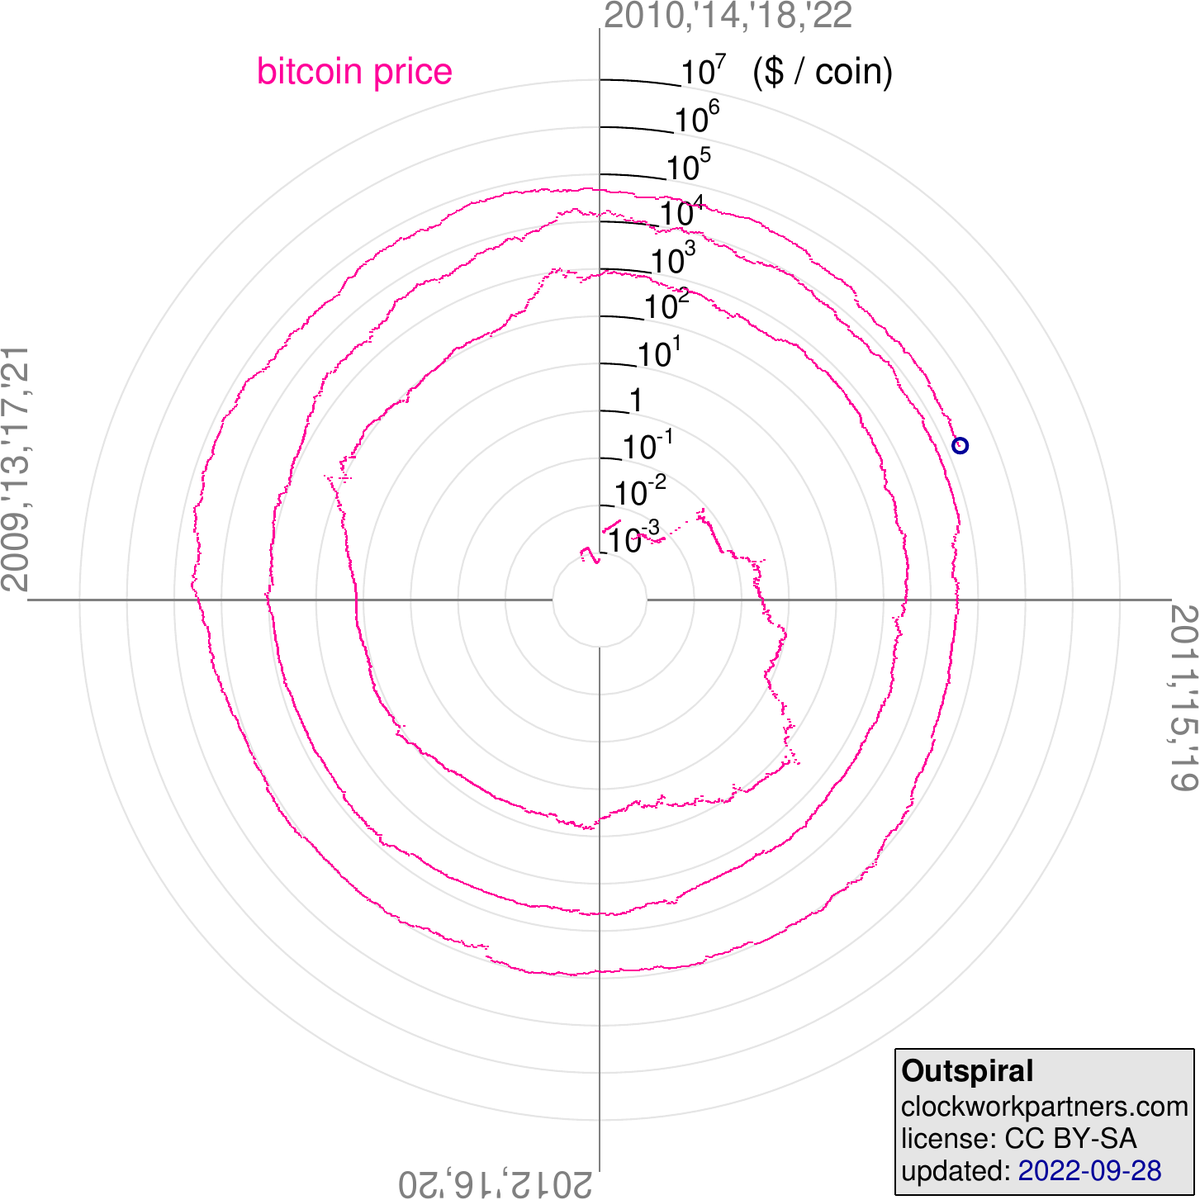
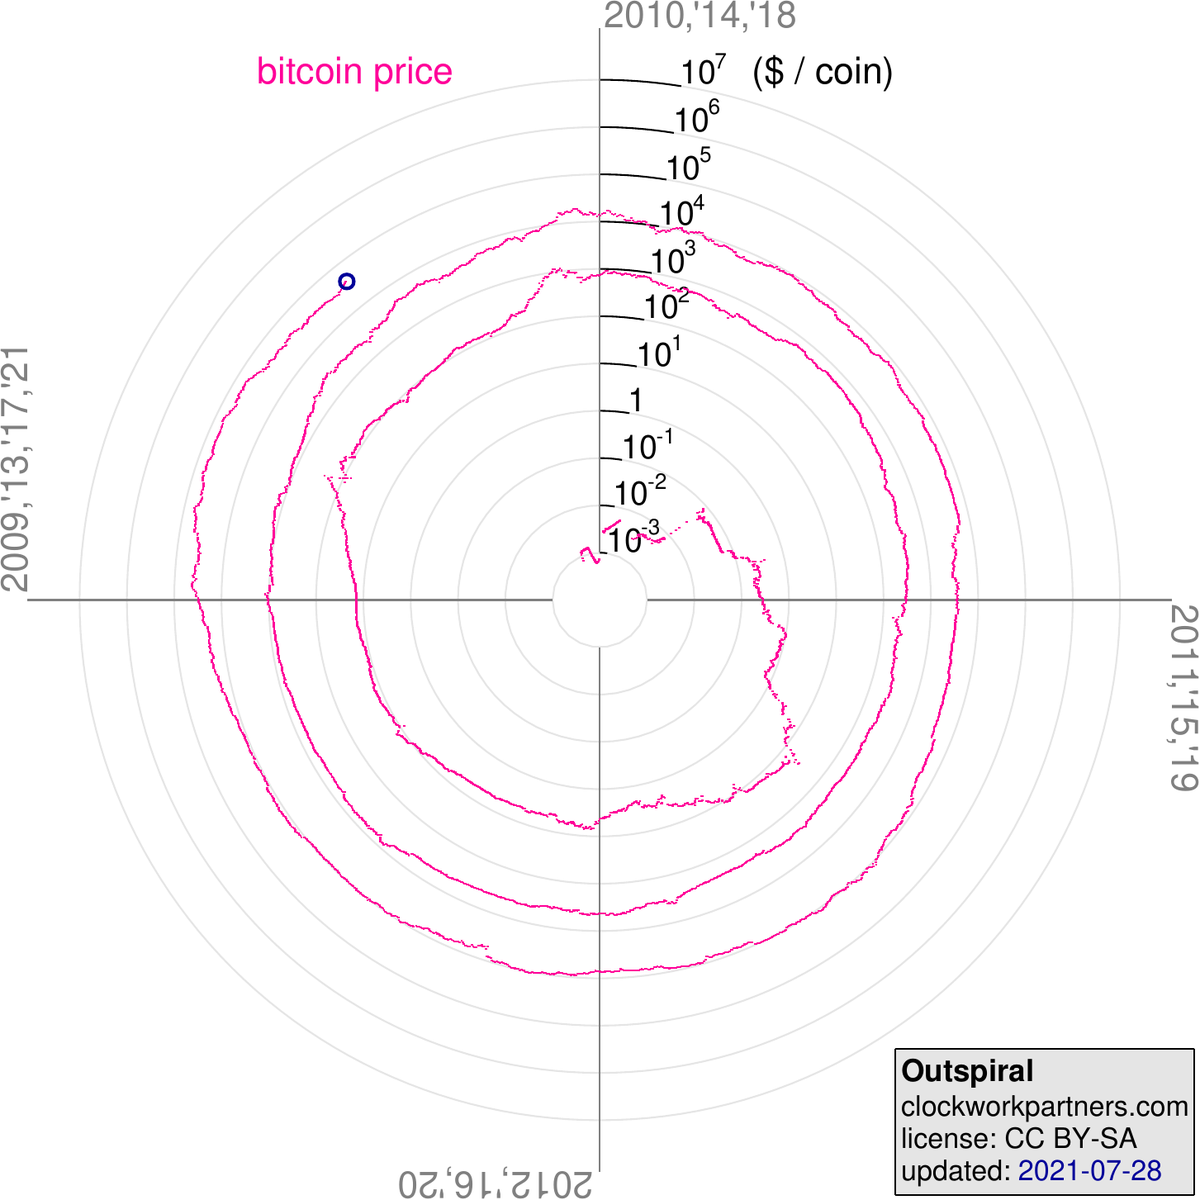
one dot per day. radius indicates log(price/$1). see description at https://t.co/y8V6R4edqk