I agree with you so far, I'm testing it out. The tool itself is strong and pretty polished for a new version, the model is fast but has limited failure modes (it tends to stop instead of trying new things) but it's not strong enough at coding to take any implementation time away from codex/claude. It has some value at exploration tasks (context generation) and simple implementation. I've had some success as using opus/gpt as an orchestrator and dispatch WOs to grok build to complete as it's fast and gets directions from stronger models.
I assume that when Grok 4.4/4.5/5, things may change quite a bit
This is a perfect time to look at relative strength and get your shortlist ready for your next trades or spot allocation.
Which coins have dropped less than others?
For example memecoins have seen some big drops but $PEPE and $BRETT have dropped much less than others. $DOGE has also held pretty strong in comparison.
Which utility coins have performed quite well? e.g $TON or $ONDO.
You can use tools like @OrionTerminal or you can create your own chart on tradingview
Making some good R/R trades. Big drops stop at important levels. These levels are where you want to make some high R/R trades. @luckychartape has a great video on youtube about this
@DayTrader_Steve@CredibleCrypto It's not really about him being right or wrong. It's that instead of debating his idea, you verbally attacked him for engagement.
"Leading 394k followers short when the entire crypto market is about to giga-pump. Just look at this weekly candle recovery, up 30% As I've always said, large followings are a huge red flag on CT."
Trying to farm engagement from large CT accounts by openly insulting their thesis and intentions wasn't the play here, especially when your counter-thesis ends up being wrong.
"Day Trader" Steve pulling out the weekly chart should probably have waited until it broke above the resistance
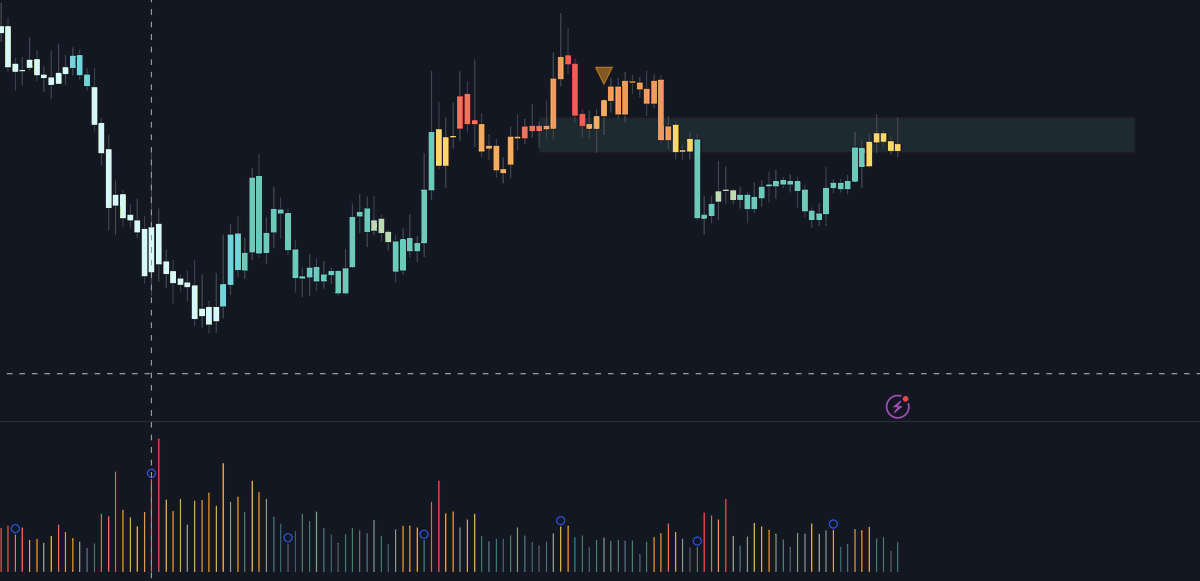
$TON 4H
Failed breakout as expected from the lowering volume and heat divergence (previous post).
Short still intact. We've seen some volume at $7 which might indicate some support but we'll watch how price reacts. If not then I'm targeting the green box below.
$TON 4h
$TON has been moving strong against the market with very bullish sentiment. The reversion signals have been catching these moves nicely but where are we now?
We've been in a range since April like most of the market sitting mostly in the upper end.
We've recently seen a reduction in heat, potentially forming a double top and failing to breakout.
We keep trading the range here until we breakout or breakdown.
Taking a Medium risk short here.
If we get stopped out, we trade the breakout and move on.
Being ok with taking the loss means you trade keep sensible size and can react sensibly/switch direction.
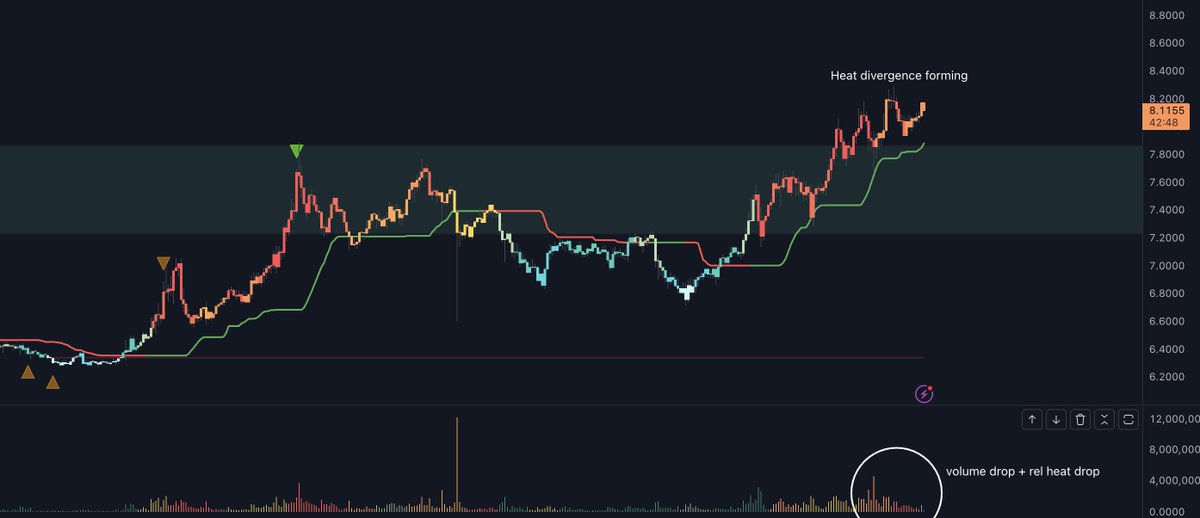
$TON 1H
It broke the upper end of the range but so far unconvincingly.
Its been respecting the trackline through the range high but volume is reducing with a heat divergence forming as well. Would like to see some volume before switching long.
I have the short running with a stop at $8.5 and i'll leave that running until we see breakout confirmation/continuation or it stops.
Going to escape the CT drama for a minute and look at what's happening with ALTS.
TLDR:
- We're sitting at alt range lows overall with possible signs of acknowledging support.
- $USDT.D looking like it's ran into resistance meaning we may see some relief in the market overall.
- $BTC.D looks like it might be running into resistance and losing momentum.
We might see some market wide relief.
$TOTAL3 1D
Alts have been kept in a more narrow range since mid April. Previously we've seen high volume at the bottom as well as at the local high, with us sitting at the recent monthly level for support.
Currently on fairly low volume with a mellow spike to stop the move within the range and we'd really expect to see some volume come in for any substantial move (up or breaking down)
The next substantial leg down would take us into the 500b-530b mark if it were to happen.
Lets look at the $BTC.D 1W
BTC.D feels like it’s running out of steam as we’ve been heading towards long term resistance.
We’ve developed a heat divergence and have recently printed a reversion triangle.
It wouldn’t surprise me if we see a push/wick into resistance before before seeing alts close the gap and see some performance.
Lastly lets briefly look at $USDT.D 1D
$USDT.D has recently run into resistance with signs of rejection, meaning the the market overall would see some good performance if it holds here.
We've seen low volatility at the highs which makes me think we may head lower here, even if it's just to give $BTC/alts a chance to get back to the current range highs.
So what does this mean for alts?
3 main scenarios here to play:
- The range low holds and we pump
- We make one more local drop to around 580b (bottom of green box) to wick out over leveraged longs, then we pump
- The range doesn’t hold and we drop down towards 500b
A possible outcome to me is that we see a wick down to flush any remaining longs, helping BTC.D push into resistance before seeing alts fight back.
I’ll be trading this like the range it is, picking alts with strong relative strength and placing some small longs with stops below the range low (outside scam wick low territory) and see what the market does. If we see some strength I’ll scale in accordingly and if we drop, I’ll look towards the next area low.
To reduce risk I'll keep a couple my hedge shorts (reduced size) running in weaker alts.
People been calling for the biggest alt season in history for a while and now that alts bleed a bit are tweeting that alts are fucked.
CT Really shows you how 99% of traders blow their accounts.
@farewell124 @TheFlowHorse It's relative to the individual. That's why @TheFlowHorse said 99% of people. Most of crypto/twitter aren't making money in these markets, regardless of what CT wants you to believe
Someone told me today that they're not buying stocks because they're "too expensive" right now.
This mentality will ruin you.
Things are usually more "expensive" because people see value in them, same goes for "cheap", things are usually cheap because people didn't want to buy them for their previous prices.
If something is performing well relative to the market, then it's a because people see more value in it and have been more willing to buy it at recent prices.
Prices can always continue to go up past "expensive" and continue to drop below "cheap". Relative performance is a much better marker of value.
$ETH 2h
Some people are calling the local bottom on $ETH.
There are some early signs that back this up but I'd like to see a little more confirmation before I jump in.
We've tapped the longest level of this range (red line) and even printed a strong reversion signal (green triangle).
On the volume heatmap we've seen a slight jump in intensity which is common of reversal periods.
For a large move to the upside I'd like to see a shift on the main heat (candle colours) to blue like we've seen on the other circled recent bottoms. If this happens we can put in a low risk long with a stop below the level.
We would then need to see some volume continuation to push through the level above
For a more risky long we could have jumped in as soon as the reversion triangle showed up. As this has confluence I'd put this at a medium risk trade. (I mention risk levels as they relate to trade size)
I'd expect to see another tap of the level or slightly above before an upwards move. If this doesn't hold and we go lower, we'll see what happens at the next level at the bottom of the range.