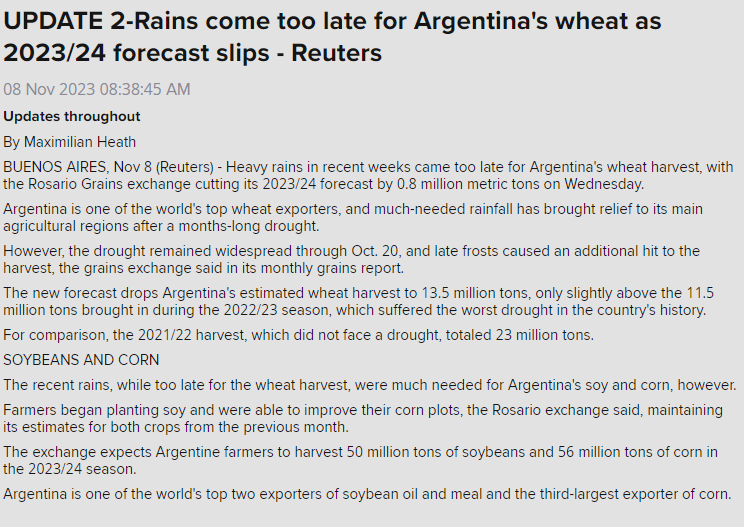
🇦🇷Rains have come too late for #wheat in #Argentina according to the Rosario Grains exchange, which cut its 2023/24 crop forecast by 0.8 mmt to 13.5 mmt.
That is above last year's awful crop of 11.5 mmt but well below the 23 mmt grown in 2021/22.
It's become a bit of a cliche to call it a paradox or a contradiction that China is building staggering amounts of both new clean power generation and new coal power plants.
It only is one if you fail to grasp the scale of China's electricity consumption growth, as most people inevitably do.
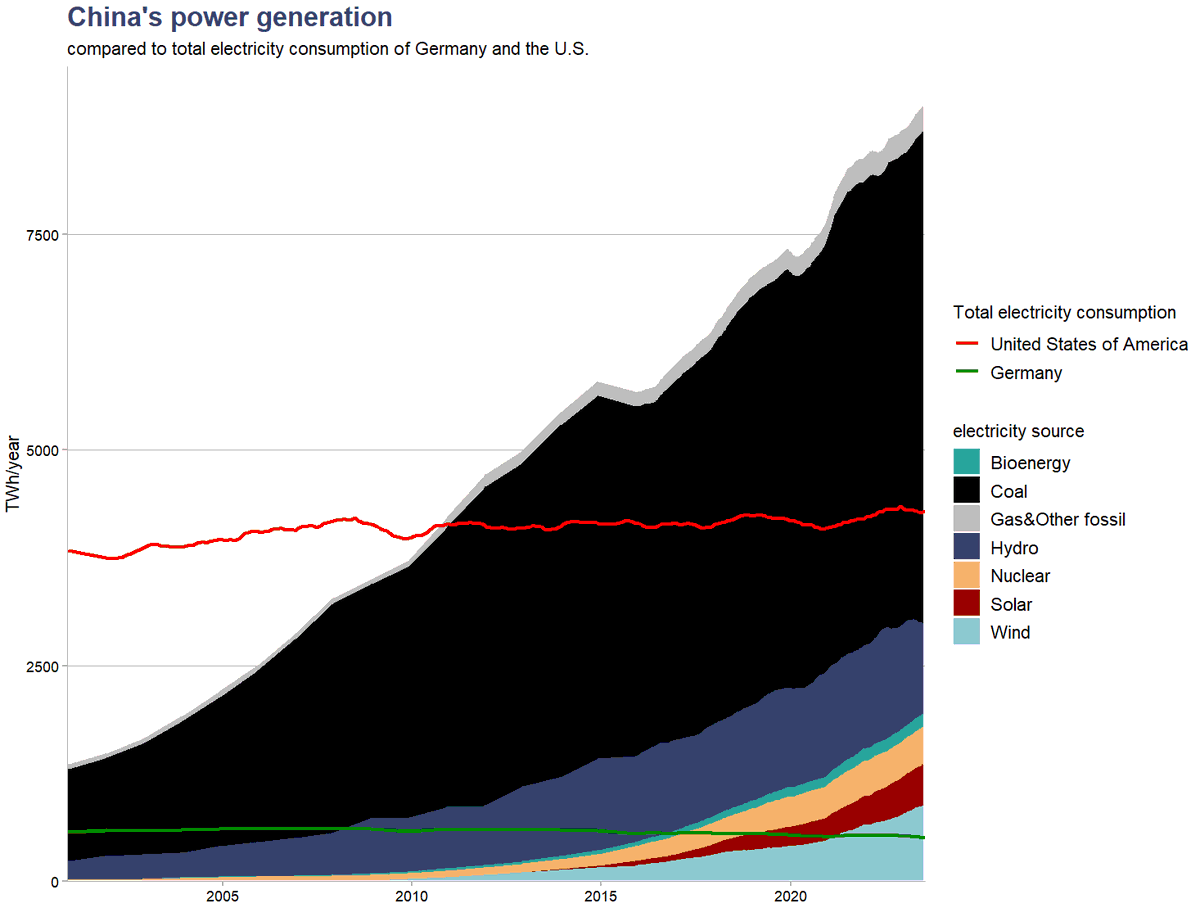
China today generates enough power from clean sources to power Germany SIX times over, up from two times a decade ago. In a few years, China's clean power generation will be equal to U.S.' total electricity consumption. China's power generation from wind&solar alone is about to hit three times Germany's total electricity consumption next year.
If China's power demand had stayed on 2009 level, the massive increase in CO2-free power generation would have made the grid 80% clean, instead of the current 33%. CO2 emissions from the power sector would have fallen by 75%.
What happened instead is that electricity demand doubled and clean power generation didn't keep up, while it did manage to increase its share from 20% to 33%. Predictably, the difference was delivered from coal, and CO2 emissions went up by 90%.
China now uses twice as much power as the U.S., after overtaking the country only in 2010. Put another way, China's additional power demand since 2010 is equal to the total consumption of the U.S.
60% of that electricity demand growth went to industry, mainly basic manufacturing like steel and other metals, cement, glass and chemicals, so it's really a function of China's extremely investment- and construction intensive growth model.
And no, it's not just about the size of China's population: per capita electricity consumption in China overtook Germany in 2022.
The good news is that China's clean energy growth is finally reaching the scale where it can cover all of the growth in power demand. This is happening even as power demand growth likely slows down with the economic slowdown.
These trends have been masked in the past year by the collapse in hydropower generation which is readily visible in the graph, but will likely become apparent in the year or two.
Most of the data for the post and the graph is from the amazing datasets of @EmberClimate.
Anti-government protests and violent clashes with security forces are gaining momentum in Guinea as frustrations grow with military leaders overseeing a promised return to democratic rule https://t.co/KCA09Xyn8d
There are renewed concerns about demand for soybeans from major importer China. A report said China is facing a new wave of Covid-19 infections & could see as many as 65 million cases per week by the end of June.
#soybeans
Germany is right now shutting down the Isar 2, Neckarwestheim 2 and Emsland nuclear power stations, the last three remaining in operation.
From tonight, it will solely rely on renewables — and lots of coal and gas (plus nuclear imports from France). Energiewende stupidity.
A week is a long time in these markets.
Spot #gold looks likely to end the week some way ofthe highs, which saw the metal trade up to nearly $2010/oz on Monday.
Last gold is around $1988/oz.
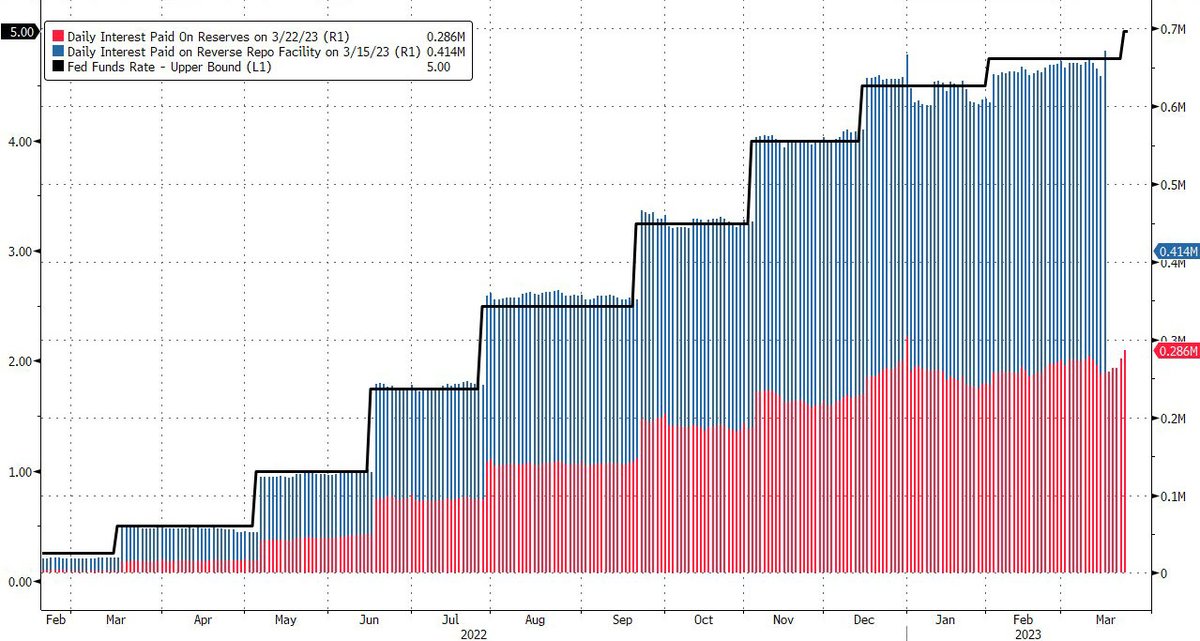
This is outrageous: the Fed - which is now insolvent to the tune of a $42BN operating loss if it was in the UK - will be paying large US banks like JPM and foreign banks like HSBC $700MM in interest every single day, as the bank run in regional US banks hits $550BN (per JPM)
Lots of false guesstimates on CRE market: the facts - size of CRE market is $11 trillion, $4.5 trillion in debt outstanding, banks account for 38% (small banks 28%, large banks 7%). The bulk of small bank deposit growth has gone into CRE
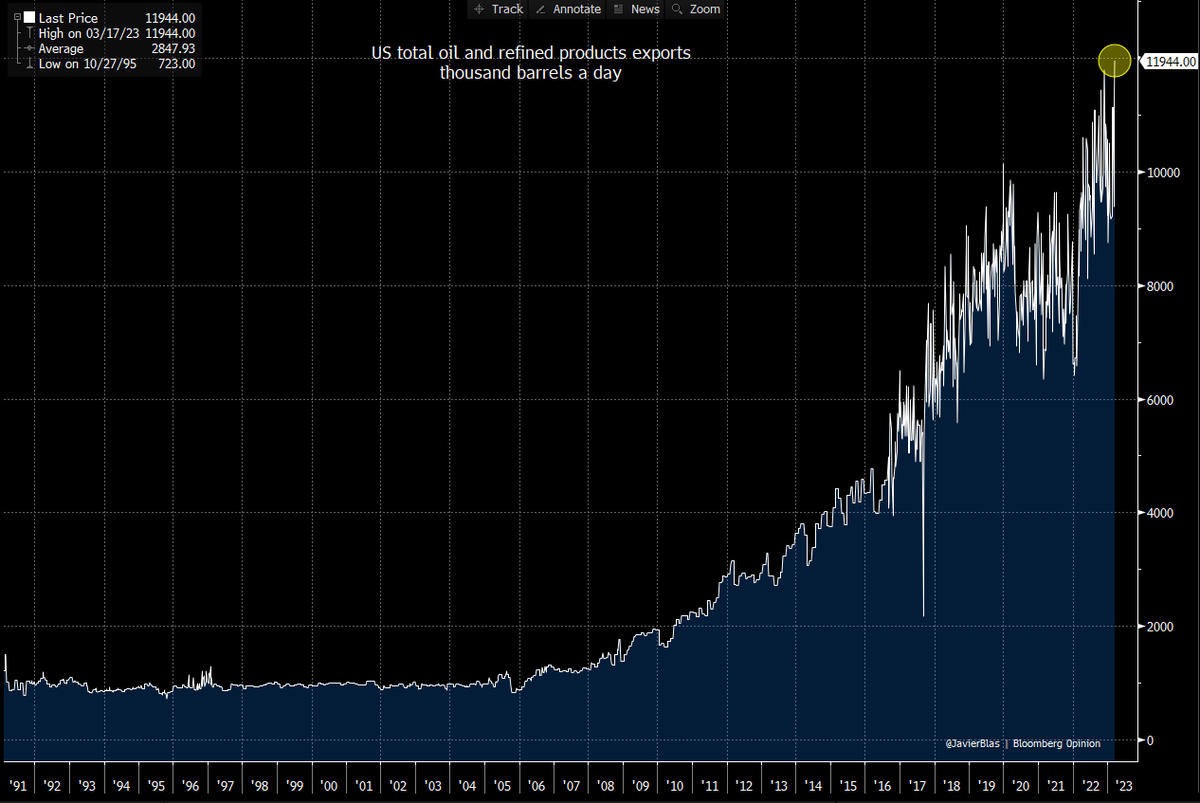
CHART OF THE DAY: US total petroleum exports (crude oil and refined products) last week surged to a new record high of ~12 million b/d. The US is the refinery of the world | #OOTT
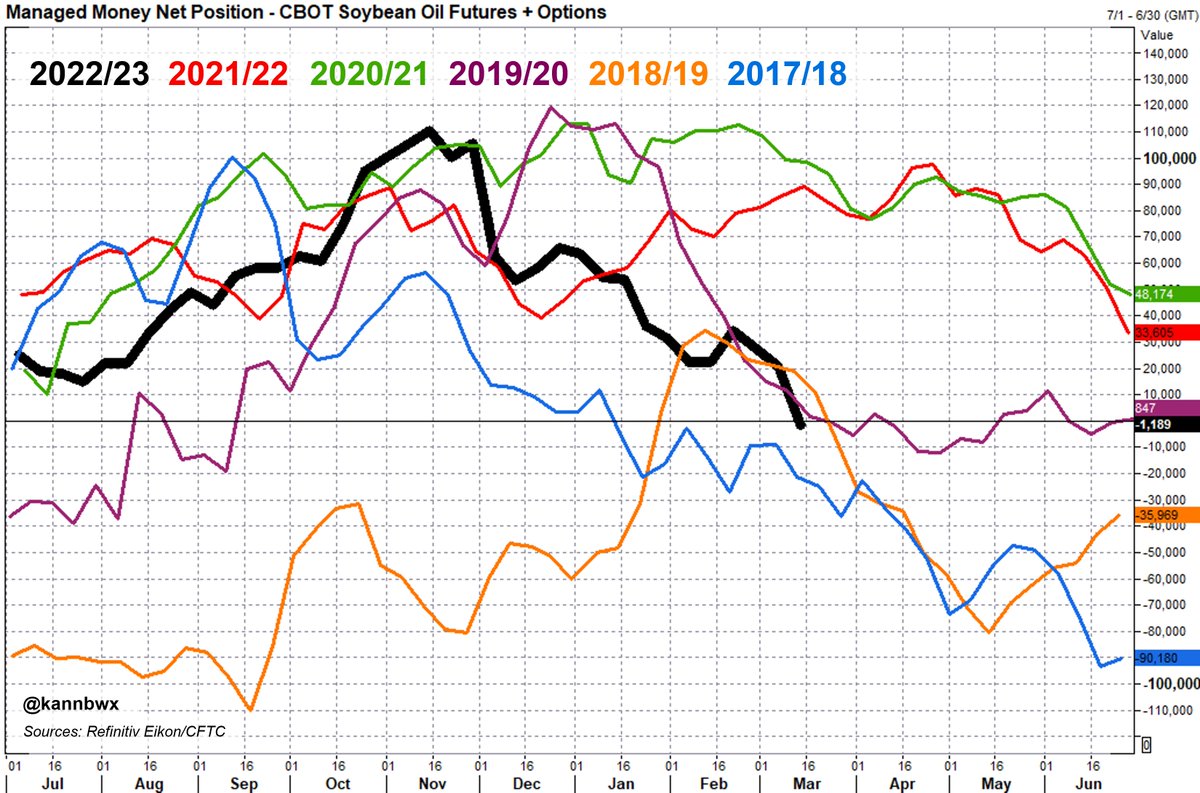
Money managers also flipped to a net short in CBOT #soyoil for the first time since June 2020. Huge increase in gross shorts in the latest week. CFTC just released data for the week ended March 14 on Tuesday afternoon.
🌽Money managers as of March 14 established their first net short position in CBOT #corn fut+opt since August 2020. Net selling of 289k contracts (equiv. to 1.45 bln bu) over the last four weeks is a record. Commercial end users turned net long for the first time since Aug. 2020.