🇯🇵 Japan Interest Rate Decision & $BTC
👉 Bank of Japan is expected to raise rates again on June 16.
Here’s what happened after the previous rate hikes:
March 19, 2024 -> $BTC -23%
July 31, 2024 -> $BTC -26%
January 24, 2025 -> $BTC -28%
December 19, 2025 -> $BTC +14%
So, as you can see, it’s mostly bearish for $BTC
Now June 16, 2026 -> $BTC ???
I still think $BTC has a good chance of making new lows this month 📉 🤷♂️
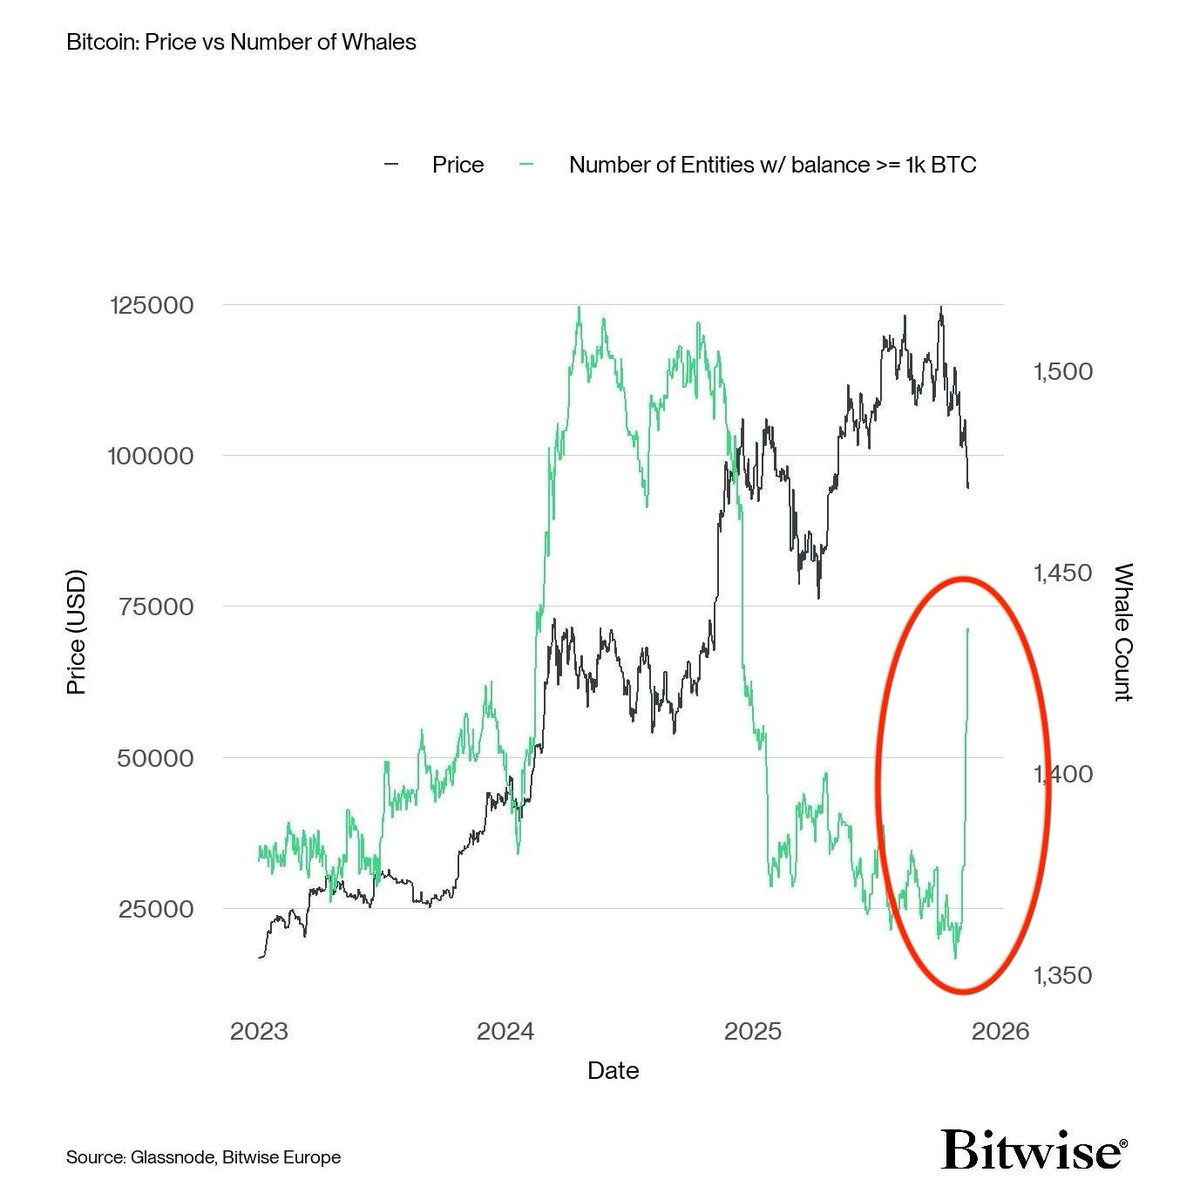
From a market symmetry perspective, a drop from $126k to $60k is not enough to correct the 3-Year Rally
$BTC needs to go at least below $50k for the macro market structure to look decent 👌
3 Years Up 📈
1 Year Down 📉
The Bear Market is not over yet. Be cautious of this mid bear market rally ⚠️
SOMETHING CLEARLY CHANGED IN THE CRYPTO MARKET AFTER OCTOBER 10TH.
And the data supports it.
On that single day, the market saw the largest liquidation event in crypto history, nearly $20B wiped out in less than 24 hours.
When we add everything from October 1st to today, the total liquidation figure crosses $41B, which is an unusually high number for a period without major macro shocks, protocol failures, exchange collapses, or black-swan headlines.
What makes this even more unusual is that equities recovered, the S&P 500 made new highs, and NVIDIA delivered strong earnings, yet crypto never stabilized.
There has been no meaningful bounce, no relief rally, and no rotation. The market has moved in a straight down line: forced selling, minor pauses, and more selling.
If you look at the daily liquidation data, the pattern is consistent.
Every attempt at recovery gets taken out by another wave of long liquidations.
Even on days when global markets remain stable or even green, crypto experiences sudden, concentrated flushes where $100M-$1B in leveraged positions get liquidated in hours.
This kind of repeated behaviour usually points toward one of three possibilities: a major entity unwinding positions, structural deleveraging inside large trading firms, or a series of systematic liquidity gaps triggered by thin order books.
But the core point is that none of this has been officially confirmed. Despite the scale of the event, there has been no clear explanation from any market participant, no statement from large funds, and no evidence released showing what started the chain reaction.
The strange part is that nothing in the macro environment on October 10th justified a liquidation wave of this magnitude.
There was no ETF rejection or approval, no regulatory shock, no significant economic data, and no on chain failure.
Yet the sell off created a structural shift in market behaviour that has continued for 45 days.
Traders were wiped out, open interest collapsed, and liquidity thinned across major pairs.
Even now, the market continues to respond to small moves with outsized liquidations. This suggests that the initial event on October 10th did more damage beneath the surface than the market has understood.
After such a large liquidation event, markets typically retrace or consolidate to rebalance positions.
But we’ve had none of that. Instead, the selling has looked systematic and controlled, almost as if a single large entity or a small group is still in the process of reducing exposure.
That is the part the industry still has no clarity on.
Billions were liquidated, liquidity conditions changed, retail was heavily impacted, and yet we still do not know who absorbed the losses or who benefited from the unwind.
With over $41B liquidated since October 1st and $20B in one day, the market deserves transparency about what led to this sustained breakdown in market structure.
And this is exactly where the Digital Asset Market Clarity Act matters.
Because when $41B gets liquidated in six weeks with no confirmed trigger, the real issue is the lack of clear rules around market behaviour.
The CLARITY Act directly targets the loopholes that allow this kind of unexplained move:
• Bans wash-trading
• Gives the CFTC real-time monitoring to flag abuse
• Criminalizes spoofing and front-running
• Requires proof-of-reserves and monthly audits for all US-facing exchanges
If these standards were active today, we would at least know who was behind the October 10th liquidation wave and what actually triggered it.
The market doesn’t just need stability, it needs clarity.
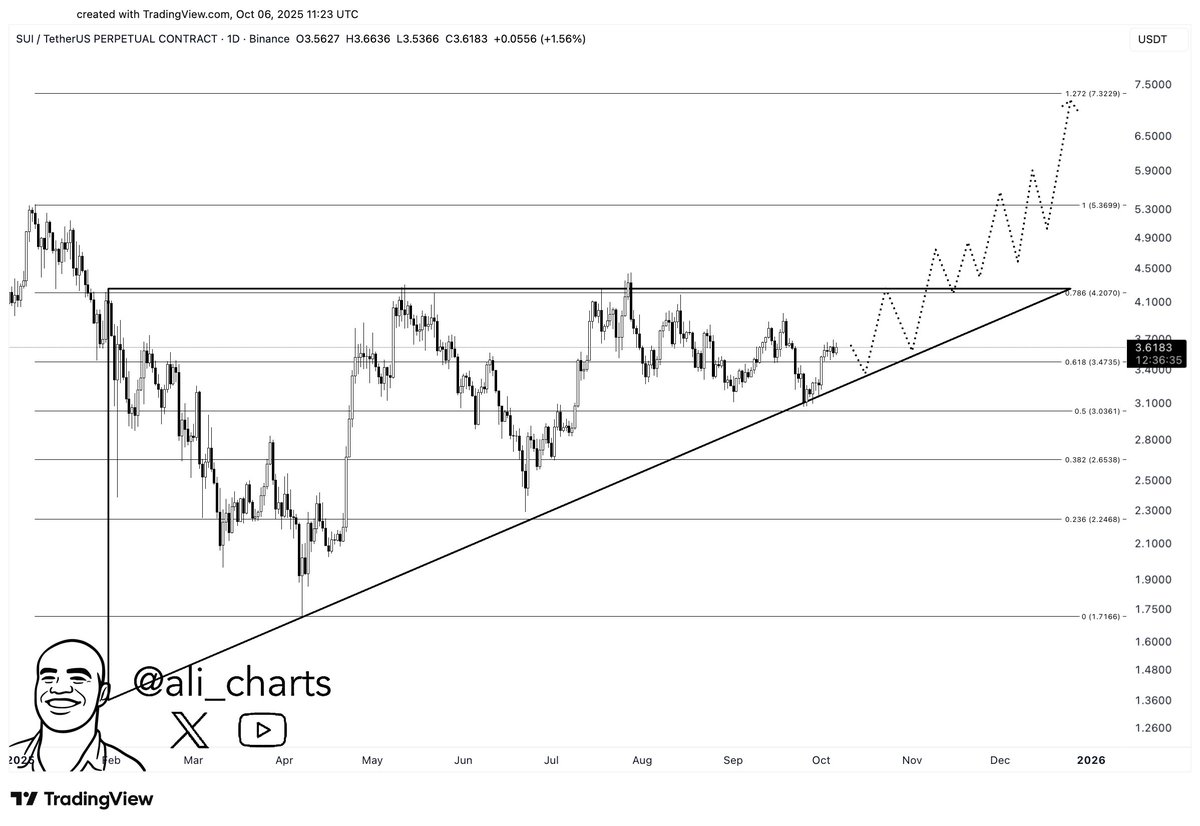
$SUI Update
The October 10 crash wrecked many altcoin charts, but on Coinbase/Bitstamp $SUI still looks good and there's a chance for a new ATH.
We can view all the PA from May to October as an Expanded Flat correction.
📌Key Levels to watch: $1.99 & $1.71
📍$1.71 is the invalidation level for this bullish scenario
$BTC.D still has plenty of room to move lower, so that makes me optimistic
#OTHERS#Alts 1M chart
What if this cycle is gonna be twice as long as the previous one? 🤔
If so, $Alts are still in the ‘pre-parabola’ phase and we just had a classic leverage washout 👀🔥
For people still don't know how bad yesterday was, here quick summary:
$ATOM went from $4 to $0.001
$SUI went frim $3.4 to $0.56
$APT went from $5 to $0.75
$SEI went from $0.28 to $0.07
$LINK went from $22 to $8
$ADA went from $0.8 to $0.3
Top 100 blue chips nuked 80% in a few minutes.