With the change in data reporting that coincides with the expiration of the COVID-19 public health emergency declaration on May 11, 2023, we have paused regular updates of our estimates. As we examine options moving forward, estimates through May 8, 2023 will remain available.
We have updated our data source for weekly cases at the county & state level - we are now using CDC reported weekly case counts, as JHU data will not be updated after March 10, 2023. With this switch, we can continue to generate weekly infection estimates in US states & counties.
@covidestim Timely updates to estimates of infections at the county and state levels in the US, still available at https://t.co/tzmpqDkDbr. Helpful tool for understanding local risk of exposure, even as surveillance has become spottier.
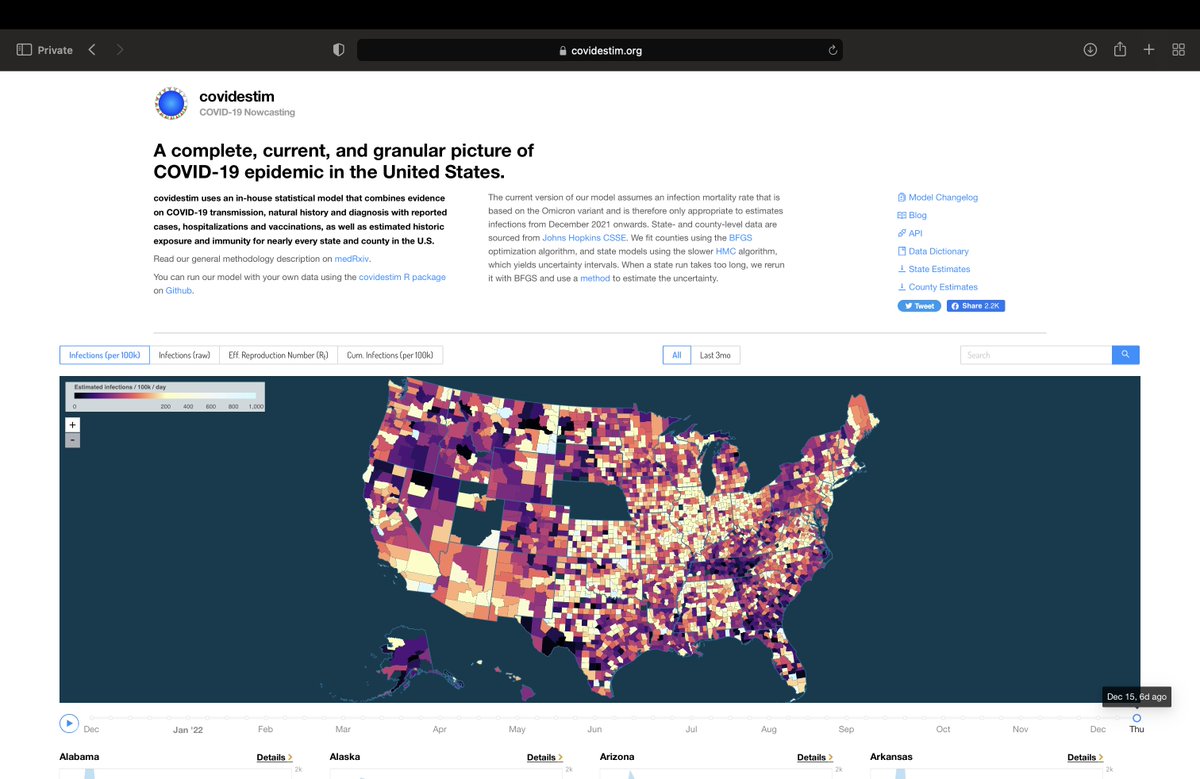
new color scales are available for several of @covidestim's maps. If you're worried you'll miss the old colors, don't fret, you can toggle back to legacy colors on the site. Check them out at https://t.co/nZTrjPU6B3
If you are preparing for holiday travel, you can plan ahead and learn about county-level COVID-19 by visiting our updated @covidestim website at https://t.co/nZTrjPBXmV We've added a few new features and revamped our look. Wishing everyone safe and healthy travels this winter.
We are thrilled to share our manuscript describing the model behind covidestim and our estimates of the 2020 US COVID-19 epidemic in each state. Read more here:
https://t.co/QPX4Zg3loy
@LotInLifeProd We currently do not have a single scheduled update day, but are actively working on syncing our updates to the release of the weekly hospitalization data. We will be sure to share when we have that sorted out!
@covidestim is back with weekly estimates for the U.S. COVID-19 epidemic since the introduction of the Omicron variant. Estimates run 8 Dec 2021 - present. Check out current estimates at https://t.co/c2pusF6E3s; estimates to be updated weekly based on most recent data available.
@Nikadmiles If you are interested in reading a bit more about COVID-19 data, check out this blog post, https://t.co/cueYQgoAeF While written prior to the recent updates to @covidestim, these issues are still relevant concerns for any modeling effort in the United States.
@Nikadmiles Due to the incompleteness & ever-changing variability in test reporting, the covidestim model uses data beyond reported cases in its estimates. We include steadier data on hospitalizations & vaccinations in order to better capture disease burden.
Our contributor @ted_h_cohen describes @covidestim estimates in a discussion of reinfection by @thedayct Unfortunately, data gaps make it impossible to track reinfections empirically, but covidestim now includes reinfection potential, allowing for cumulative infection estimates.
Although there’s “wide uncertainty,” @covidestim, a collab between @YaleSPH and @HarvardChanSPH, estimates that Connecticut has seen 131,000 infections per 100,000 people to date. Prof. @ted_h_cohen discusses reinfections with @thedayct.
https://t.co/e5KCLz9MvJ
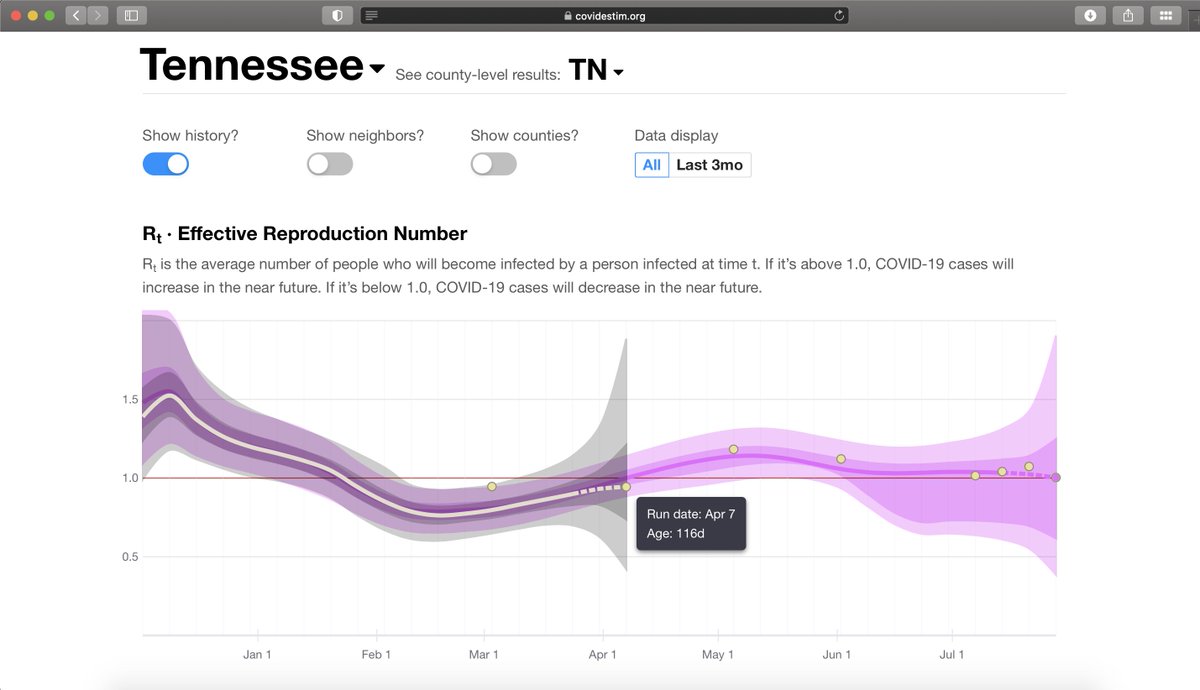
New feature: with the "Show history?" toggle active, if you hover on the points on the graph, it will now display not only the past trend, but also previous uncertainty intervals.
@bnelson44@reichlab We provide nowcasting estimates that are based on reported data📈. At certain points in the epidemic, our estimates may look quite a bit different than the reported data (but that's the point!🎯) Examining these differences is an opportunity to better understand the COVID-19🦠.
@catsav@reichlab Our color scheme needed to grow with infection waves. Prior to Delta, we had a monotonic color scheme that topped out at bright orange/yellow. With Delta & Omicron, we had to expand that range. Our team worked to develop the best way to expand while preserving consistency.
Wondering how many people in the US have been exposed to SARSCov2? We used @covidestim infection counts & reported vaccination coverage to estimate immunological exposure & effective population immunity against infection & severe disease for each state & county over 2020-2021.
Population immunity to pre-Omicron and Omicron SARS-CoV-2 variants in US states and counties through December 1, 2021
✅ Just Accepted
🔓 Open Access
🔗 https://t.co/5MICkmk1FY
We apologize for any inconvenience caused by this disruption. We are working around the clock to get Covidestim back up with revised nowcasting estimates. Thank you for your understanding and patience.
As of the evening of March 2 we have paused our nowcasting estimates on covidestim due to necessary model changes for SARS CoV-2 omicron and the post-omicron era. While these changes are being implemented we have frozen our estimates at their Dec. 2021 values.