Thanks to AI, lots of intereretsing dashboards to track data in markets in various ways.
The Breadth Ledger - https://t.co/67VfvPv5t1
Company Filings - https://t.co/EOE8DchMws
MF Factor Attribution - https://t.co/sxaCrc6Esn
Tipsheet - https://t.co/kOsdJEAHdy
I built a seven-step process to turn market cycle analysis into a system you can actually execute.
We start by defining the regime filters and establishing clear rules for when to shift our exposure. From there, we test those rules across historical data so we know exactly how the model behaves before putting real money on the line.
That structure is how I remove the guesswork when the market starts turning.
I stopped failing in the markets the moment I stripped away secondary indicators and specialized in a single system.
Traders constantly ruin their edge by mixing conflicting strategies they read about online. I focus entirely on my core setups, perfecting my execution on price and volume alone instead of jumping between methods.
Mastery comes from extreme simplification.
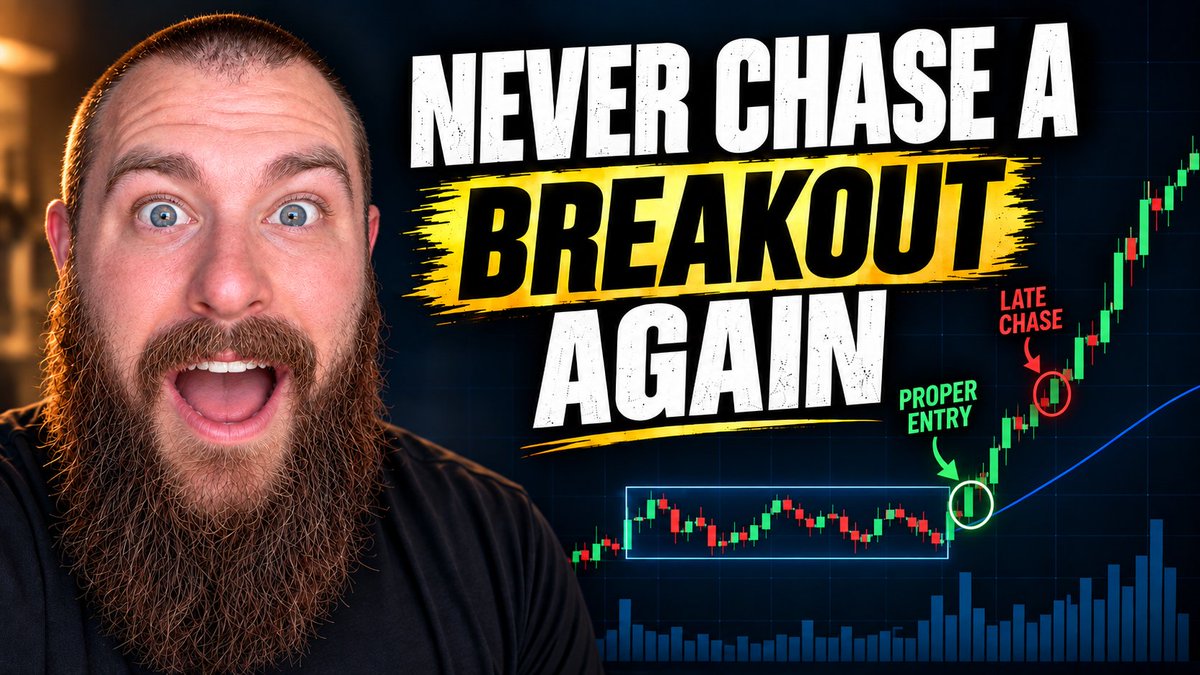
🚨New video is up.
I break down the key characteristics I look for in momentum trading setups. I show what makes a breakout actionable, what makes a strong pullback, and how to avoid chasing a breakout once the move is already started.
If you trade momentum, this is the framework I use to separate quality setups from noise.
https://t.co/551uN7zgJi
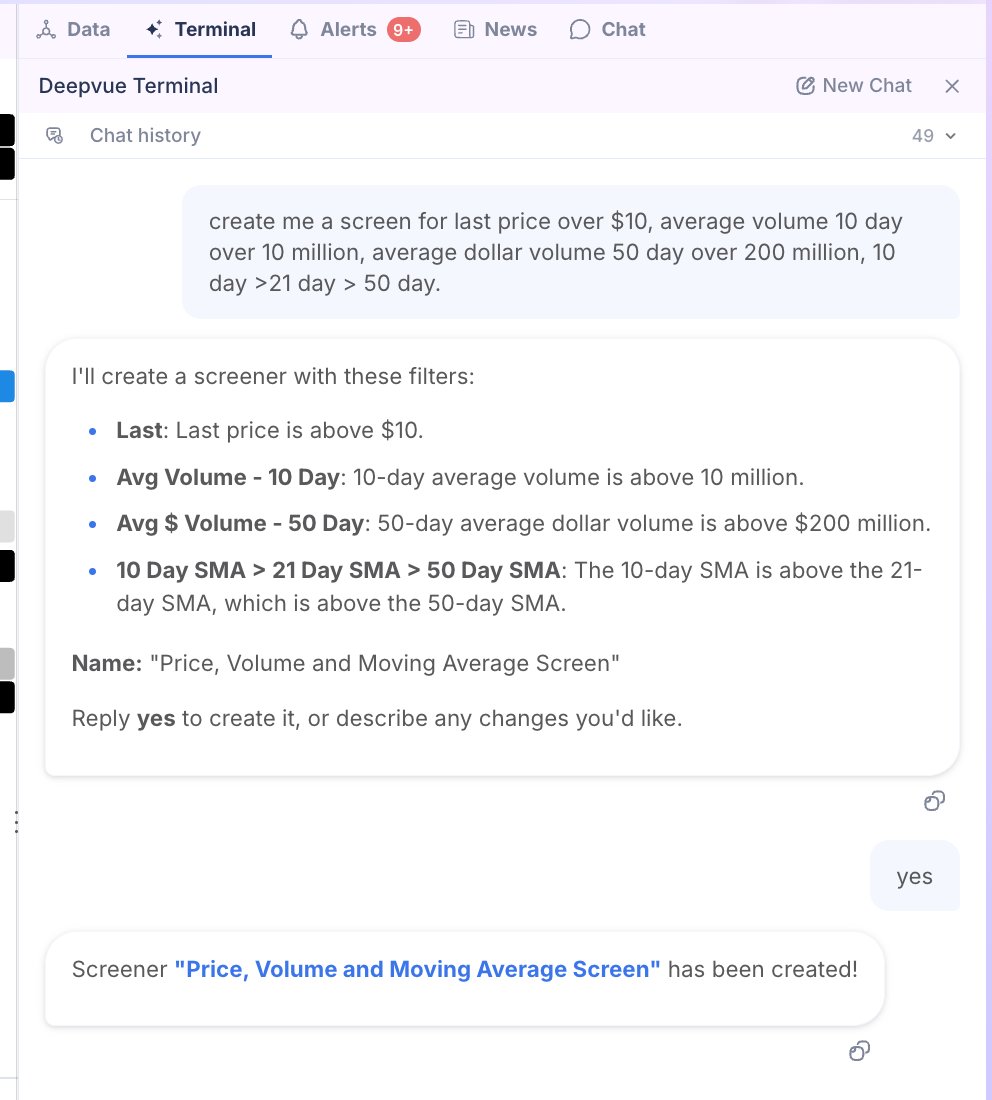
Nice simple and powerful liquid trend screen from @FranVezz
Instead of manually clicking filters you can also use the @Deepvue AI and type/speak the criteria you want.
It will confirm and make it for you in seconds.
(must use forward slash and select create screen action first)
Just shared a new video on one of the scanners you can use regularly.
Instead of checking hundreds of charts manually, this scan helps you quickly find stocks trading close to the 20 EMA ( or 50 ema ), where many good opportunities begin.
If you use the 20 EMA ( or 50 ema ) in your trading, this may save you a lot of time.
Video Link - https://t.co/6ZYYGT5375
I am in love with the new @Deepvue charts. It is the fastest chart I've ever used over any other charting platform you can think of.
Also, a little peek at how I set up my execution dashboard:
1. Focus list
2. Portfolio watchlists
3. Three chart setup (daily, 65 min and 5 min)
4. Data panel
5. Alert module
6. @Deepvue AI
Well done @AmeetRai@RichardMoglen@RossHaber for the quick iteration and being super responsive to my constant feedback.
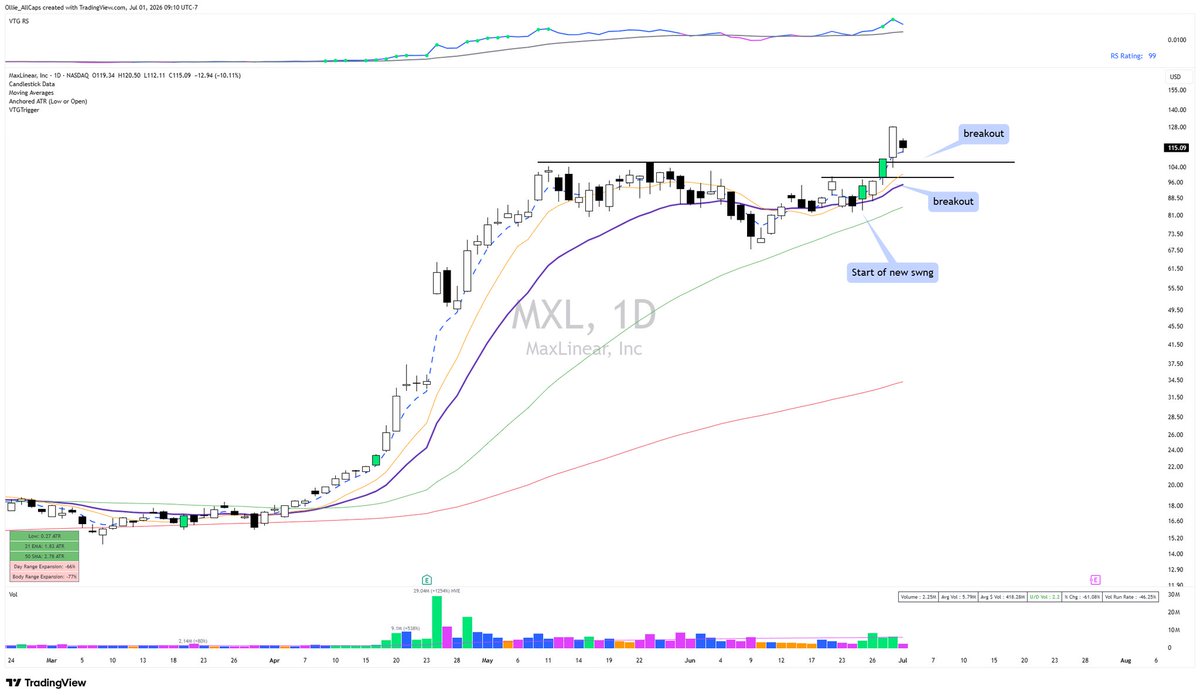
My objective is to identify the start of a new swing.
Sometimes that happens on a breakout.
Sometimes it happens several days before one.
If you are a low risk swing trader, by definition you must buy on the first day of the swing to maxx out R/r.
Lots of people arguing with @PradeepBonde over this very simple concept. They are turning blue in the face.
They want to be right instead of learn.
🔍 Anatomy Of A Winner: $DELL
I bought $DELL on April 16th.
Not because I knew it would become one of my biggest winners of the year. I bought it because it showed the same characteristics I've seen repeatedly in past market leaders.
• The goal isn't to predict the future.
• The goal is to recognize the footprints before everyone else does.
The first thing I checked wasn't the stock. It was the market.
My Market Trend Model was green, giving me permission to look for new long positions. Once that box was checked, $DELL quickly moved to the top of my watchlist.
Here's what stood out:
• Leading stock in the strongest AI data center group
• Multi-week orderly consolidation with higher lows
• Price surfing the EMA 8
• Strong Relative Strength
• Heavy institutional volume and exceptional liquidity
• Management forecast AI server revenue would double
None of these factors alone would have been enough. Together, they created a setup with a clear statistical edge.
The chart wasn't perfect. The base wasn't especially tight, and the breakout day produced a very wide range bar. Normally, I prefer tighter entries. On top of that, I wasn't fully convinced by the story because DELL wasn't the type of exciting AI stock everyone was talking about.
But trading isn't about finding perfect charts. It's about weighing all the evidence and deciding whether the positives clearly outweigh the negatives.
I started with a 10% position and defined my risk with a 4% stop.
That small risk wasn't there to protect this trade. It was there to give myself the chance to capture a very large winner if I was right.
The position eventually produced a 16R gain and returned roughly 131%. I managed it using my EMA 21 rule and sold into the earnings-driven climax move, closing the final shares around 442 in the pre-market.
One lesson continues to repeat itself: Tight risk creates asymmetric rewards.
One exceptional stock can make a huge difference to your entire year.
Don't study $DELL because of its ticker. Study it because these patterns repeat.
The next great winner will have a different name. But it may leave the same footprints.
XP vs EM
Both scores are designed to do the same job, and on most days they will agree. Where they tend to differ is at turning points. XP, being recursive and heavily weighted on its prior value, is by construction a bit smoother and slower to flip. But mostly, they convey more-or-less similar interpretations. If you have to choose one, then choose EM.
All the credit for the idea goes to the amazingly brilliant @stocksgeeks. Consider the XP score as a fan work for the original.
I also take this moment to thank my friend @EquityCraze for hosting & maintaining the repositories & updating the numbers daily.
🚨 BREAKING: I asked Claude to improve my LinkedIn profile.
It didn’t just improve it. It made it a recruiter magnet.
Here are the 7 exact prompts I used:
Everyone screaming “buy the dip.”
I’m waiting for the real panic.
If we get a major correction, these are the levels I’ll be loading:
$MSFT: $290
$AMZN: $175
$META: $450
$NVDA: $115
$GOOGL: $220
$AAPL: $200
$TSLA: $280
You can’t be afraid to buy into the fear.
If you’re under 35 this correction is a gift.
I’m looking to buy…
$MU below $300, memory is sold out until 2028
$META below $450, social media is addicting
$NBIS below $70 , $27B Meta deal + $2B Nvidia investment
$SOFI below $14, CEO continues to buy millions this month
$ASTS below $70, 45-60 satellites by end of 2026
I’ve never seen all my secondary breadth indicators this oversold—ever.
Right now, the market is highly news-driven, with any headline capable of moving it sharply in either direction. That said, I suspect we’re on the verge of a short-covering rally in the coming sessions.
From a sentiment perspective, everyone seems convinced this is just a dead cat bounce. Traders are scared to hold positions overnight, and frustration with the market is widespread. Most people, especially those who’ve been burned recently, have little to no interest in getting involved right now.
AI Investing Playbook when the Selling Stops.
The Reality:
AI is not hype — it’s a once-in-a-generation shift.
•It’s disrupting labor ($10–20T market), not just software
•Adoption is global and board-level across industries
•But rollout will take years, not months
👉 Opportunity for traders:
This is a long-duration trend — not a quick trade.
👉 Stay focused on:
•Semiconductors & infrastructure ( $NVDA, $AVGO, $ASML)
•Data & cloud ( $SNOW, $NET, $FROG)
👉 Be cautious 🟥 on:
•Traditional SaaS