📺 Oversold Rally Hits Key Resistance — Is Another Selloff Coming?
Please ❤️like and 🔁share with fellow growth stock investors
@TedHZhang notes that the market has rebounded sharply after a four-to-five-week correction, but the technical picture remains fragile.
The Nasdaq $QQQ posted a weak follow-through day, market leaders remain in "Protect Mode", and new liquid leadership is nowhere to be found.
Is this the beginning of a sustainable recovery or just another oversold bounce before the next leg lower?
*
The overall market state has improved to neutral, but short- and medium-term trends remain largely bearish.
$QQQ is struggling below key moving averages, while $RSP and small caps $IWM continue to show relative strength.
Long-term trend (above 200-day) is neutral, but the quality of the recovery remains questionable.
*
The S&P 500 $SPX / $SPY has rallied for four consecutive sessions, only to encounter resistance near its 10-week, 20-day, and 100-day moving averages.
The Nasdaq 100 has also bounced for four straight days but reversed near its declining 20-day moving average.
More importantly, volume remains weak, suggesting limited institutional accumulation.
$RSP continues to outperform, with relative strength reaching new highs ahead of price.
However, declining volume raises questions about the durability of the advance.
Meanwhile, $MAGS remains notably weak, reversing lower and failing to even reach its 20-day moving average.
*
The biggest gains have come from AI infrastructure stocks.
CoreWeave's $CRWV earnings triggered aggressive short covering, sending our Revere AI 100 up 5.74%.
But many of these stocks remain in established downtrends. These violent mean-reversion rallies can create the illusion that the correction is over, even as underlying technical damage persists.
*
Semiconductors tell a similar story. $SOXX has rallied for four consecutive sessions but was rejected near its 200-day and declining 20-day moving averages.
A rebound toward $161.70 could potentially offer an attractive short-selling setup.
Memory stocks $DRAM are also approaching resistance, while $WGMI remain too extended to short immediately. A recovery toward $38 could provide a better opportunity.
$LYTE also continues to struggle in a persistent downtrend.
*
Elsewhere, $IBIT is testing critical support around its 30- and 40-week moving averages after six consecutive weeks of declines.
A confirmed weekly reversal could open the door to a recovery toward previous highs, but that support must hold.
*
Adding to the uncertainty, the U.S. dollar $DXY has broken out forcefully, extending an uptrend that began in June and was confirmed in September.
Dollar strength has historically created headwinds for equities, including during the 2022 bear market.
At the same time, the S&P 500's Average True Range continues to rise, signaling increasing volatility.
*
Friday's PPI report could provide the next major catalyst.
*
So, a powerful four-day rebound doesn't erase weeks of technical damage.
With weak volume, deteriorating mega-cap leadership, rising volatility, and major indexes approaching resistance, the risk of another selloff remains elevated.
Until genuine leadership emerges and buyers reclaim key moving averages with conviction, this looks more like a countertrend rally than the start of a sustainable new uptrend.
*
Watch this Short video where @TedHZhang breaks it all down in detail 🔽
📺 Hot CPI Sparks Bond Selloff — What's Next For $SPY & $QQQ?
Please ❤️like and 🔁share with fellow growth stock investors
@dvandenbord notes that the stock market remains in correction mode, and hotter-than-expected CPI has added another major headwind: surging Treasury yields, falling bond prices, and a strengthening US dollar.
*
The S&P 500 $SPX / $SPY is 4.1% below its recent all-time high, while the Nasdaq $QQQ has fallen 11.5%.
Yet the equal-weight S&P 500 $RSP made a new high just last week, highlighting a significant divergence between struggling technology leaders and the broader market.
*
Our market leaders remain in "Protect Mode". Short-term and medium-term signals are still RED, while the long-term outlook is NEUTRAL.
The equal-weight S&P 500 has reclaimed its 21-day moving average and remains above its 50-day. Both S&P 500 indexes are firmly above their 200-day moving averages, while mid $MDY and small-caps $IWM continue fluctuating around that level.
The Nasdaq 100, however, has failed for two consecutive sessions to reclaim its 200-day moving average. That's a critical resistance level and a warning that the rebound remains vulnerable.
*
Following the hot CPI report, the S&P 500 initially fell nearly 1%, but buyers stepped in during the afternoon, trimming losses and pushing the index into the upper third of its daily range.
That's encouraging for bulls, but there's still a major problem: very few leading stocks are showing the technical strength needed to support a sustainable rally.
*
After Thursday's major liquidation event, the S&P 500 staged a two-day rebound while defending its 200-day moving average.
Tuesday's session formed an inside day, with price consolidating near the 150-day/30-week moving average.
The same inside-day pattern appeared across the Nasdaq 100, equal-weight S&P 500, Dow Jones, mid-caps, and Russell 2000.
That makes Monday's highs and lows critical. A breakout above Monday's range could signal renewed buying momentum, while a breakdown below it could trigger another leg lower.
The Nasdaq's repeated rejection at its 200-day moving average was significant enough that we initiated an $SQQQ position in our Grotection portfolio.
*
Meanwhile, $VIX has retreated below 20 following its recent spike, suggesting some immediate volatility relief. But falling volatility doesn't mean the correction is over.
The bigger concern is what's happening in bonds.
Hot CPI sent Treasury yields sharply higher. $BND fell 0.68%, while $TLT dropped 1.32%, breaking below its three-week consolidation range.
Both 10-year and 30-year Treasury yields have broken above their recent declining trendlines.
Rising yields can pressure equity valuations, particularly growth and technology stocks, while tightening financial conditions.
*
The US dollar $DXY also rallied sharply after CPI and is approaching the upper end of its recent range.
A breakout higher would create additional pressure, especially for precious metals $GLD $GDX $SLV.
*
So, the market is attempting to stabilize, but the technical picture remains fragile.
The S&P 500 is holding important support, while the Nasdaq continues struggling below its 200-day moving average.
With inflation running hotter than expected, bond prices breaking down, yields surging, and the dollar strengthening, the bulls face another difficult test.
Watch Monday's trading range, the Nasdaq's 200-day moving average, and Treasury yields closely.
Until leadership improves and these headwinds ease, protecting capital remains the priority.
*
Watch this Short video where @dvandenbord breaks it all down in detail 🔽
📺 Market Rebounds, Volatility Plunges — CPI Is The Next Big Test
Please ❤️like and 🔁share with fellow growth stock investors
@ConnorJBates_ notes that the market staged a powerful oversold rebound on Monday, with semiconductors, memory stocks, and high-beta growth names posting double-digit gains.
Our Revere AI 100 surged 7.11%, while volatility plunged and the $VIX closed below 20.
But does this mean the correction is over? We don't think so.
*
We remain in a correction, with market leaders flashing red in "Protect Mode". Most major indexes are still struggling with their declining 21-day and 50-day moving averages, and the technical damage from the recent selloff remains substantial.
The S&P 500 $SPX / $SPY did deliver a strong open-equals-low session yesterday and closed slightly above its 8-day EMA.
The next key level is 7,620, followed by resistance from the declining 21-day and 50-day moving averages.
With the S&P's average true range now at 1.23%, volatility remains elevated despite the rebound.
*
$QQQ suffered an 18.5% correction from its recent high to its after-hours low.
Monday's rally brought it back toward the 8-day and 200-day moving averages, making this a critical technical test.
The $700 level remains important, while the undercut and reclaim of the capitulation low offers a potentially bullish signal.
But one strong session doesn't repair weeks of selling.
*
Market breadth is showing some encouraging signs.
$RSP continues to outperform the capitalization-weighted indexes, although $223.50 remains a major resistance pivot.
The Russell 2000 $IWM reclaimed 2,800 and closed marginally above its 50-day moving average.
Mid-caps $MDY are also improving, while $MAGS and hyperscalers continue demonstrating relative strength.
*
The sharp decline in volatility is another positive development.
After last week's massive spike, the VIX has surrendered much of its gains and closed below 20, suggesting that immediate market fear is easing.
*
Elsewhere, the dollar appears to be rolling over, potentially supporting precious metals.
$GLD is approaching a bullish 8/21 moving-average crossover, $GDX is showing leadership, and $SLV is beginning to form higher lows above its 8-day EMA.
$IBIT, however, remains notably weak despite the Nasdaq rebound, suggesting speculative risk appetite has yet to recover.
*
Meanwhile, $TLT continues building strength off its recent low, with Treasury yields making lower highs below their 50-day moving average.
Further declines in yields could provide a more supportive environment for growth stocks.
*
Now attention turns to CPI, followed by PPI on Friday.
These inflation reports could influence Treasury yields, Fed expectations, and whether the current rebound develops into a sustainable recovery or fades into another lower high.
*
So, this was an impressive bounce, but powerful rallies are normal during corrections.
We need to see indexes reclaim resistance, moving averages improve, and leadership broaden before declaring the worst is behind us.
For now, remain disciplined, take the market level by level, and respect "Protect Mode" until the evidence changes.
*
Watch this Short video where @ConnorJBates_ breaks it all down in detail 🔽
@FranVezz I like this group specifically $NTSK $RBRK
Solid charts and the character of this group/chart theme has been finding support on upper trendline / 50-D. Decent spots see if they can work from here.
REVERE DAILY MARKET INSIGHT VIDEO (11-9-2026):
BY @ConnorJBates_
BROAD OVERSOLD BOUNCE... BUT CAN IT HOLD? WHAT TO WATCH NEXT
LIKES & RETWEETS ARE APPRECIATED
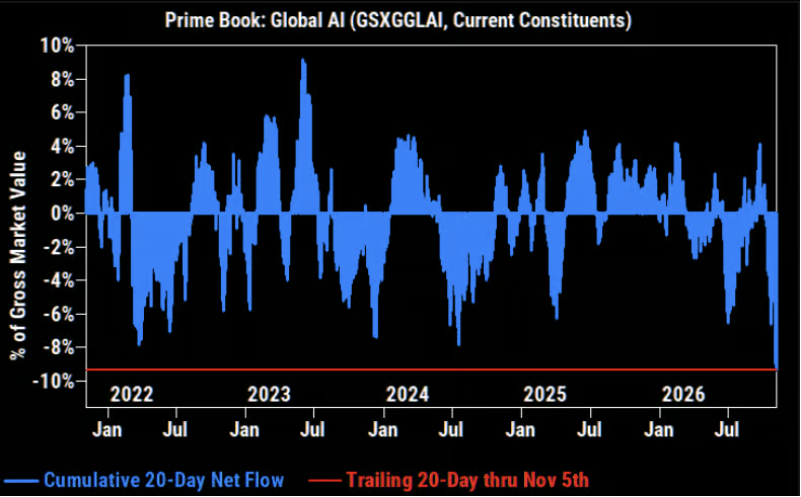
GS Prime: "On a trailing 20-day basis, the recent pace of selling of global AI stocks by HFs is the largest in more than five years."
Source: GS trading desk
Stan Druckenmiller: Knowing When to Stop Analyzing Is the Biggest Mistake We Make
I think it's the biggest mistake in our business. At some point, the analysis becomes counterproductive. That's one thing I've learned, and it's greatly to my advantage. Speed matters now. With AI and email and everything else, if you sit around and analyze a company for four months and you're not willing to operate with 15% or 20% of information, you'll often miss just a big move and then you're afraid to buy it because it has moved.
That to me is a core belief. Sometimes when the opportunity is so big and you just kind of know it, you've just got to plunge in without the proper information, do the work, and if it doesn't work out, it doesn't matter whether you're a profit or loss.
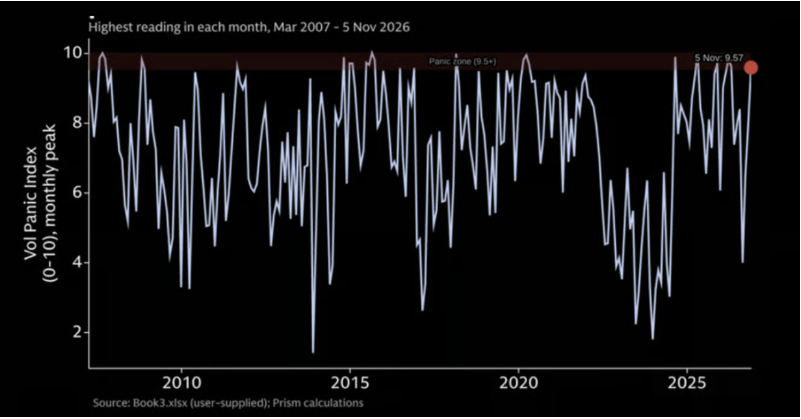
Goldman: Our vol panic index surged to 9.57 out of 10 (back in the panic zone of 9.5+). This move registered as the 3rd largest daily jump ever, which followed Wednesday’s huge decline (4th largest drop). The combined two-day swing was the largest on record, which shows how quickly the market went from relief to outright panic.
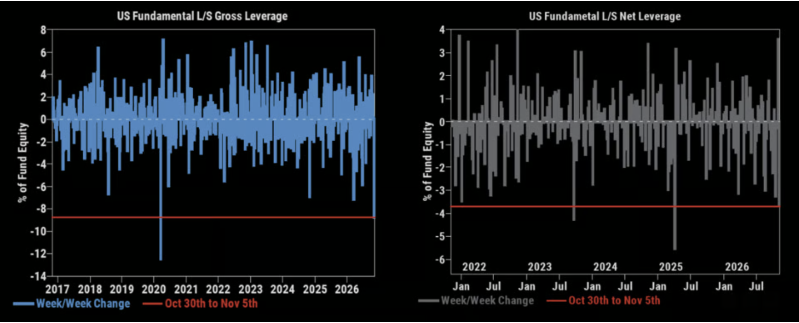
Clients had aggressively taken off protection into Wednesday’s post-midterm relief rally, leaving the market underhedged heading into Thursday’s reversal. As equities unwound and forced liquidations emerged across the HF community, we saw a scramble to buy back protection that was just sold.
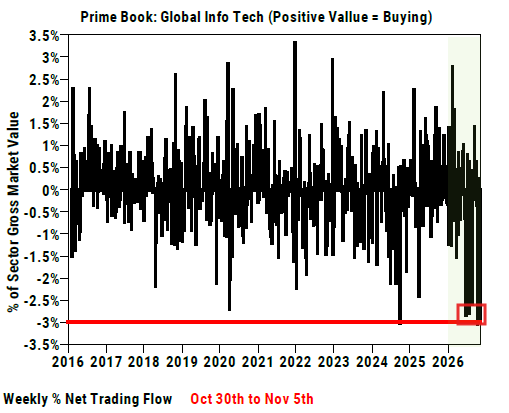
Goldman notes in that regard (the 6-month relative underperformance of AI) that last week "Info Tech was by far the most $ net sold global (and US) sector ... net sold across all regions, driven by long-and-short sales (2.2 to 1).
"In % terms, [the] week’s selling in global Tech stocks was ~on par with what we saw in mid-October and Sep ‘24 as the largest net selling weeks on our record (since 2016). Also worth noting that 4 the top 5 net selling weeks in global Info Tech on our record have occurred within the past five months.
"Semis & Semi Equip and to a lesser extent Tech Hardware were the most net sold global subsectors within Info Tech, while Software was the most net bought. US Info Tech net allocation (as % of total US net MV) now stands at 14.4%, approaching multi-year lows in the 1st/1st/3rd percentiles on a 1-year/3-year/5-year lookback."
Easier said than done & hindsight is always 20/20, but it never ceases to amaze me how there are always signs along the way.
The challenge is recognizing them in real time rather than connecting the dots after the fact.
The story of 2026. Extreme to extreme.
From a 5-sigma overshoot in Momentum relative to Low Volatility in June... to the absolute carnage we've seen in Momentum stocks... one of the worst drawdowns on RECORD for Momo basket now.
Remarkable how quickly the pendulum can swing from one extreme to the other.
Another example of how “the signs were there” all along.
Again, let me emphasize that this is MUCH easier to recognize in hindsight.
But there's always something to learn from looking back, studying the clues, and figuring out how to better recognize them in real time.
And that's really the message I'm trying to get across with some of these tweets today, both for myself and for others.
It's not about pretending we could have predicted everything. It's about learning from what happened, our market awareness, and improving our ability to recognize these signs the next time around.
The goal is continuous improvement.
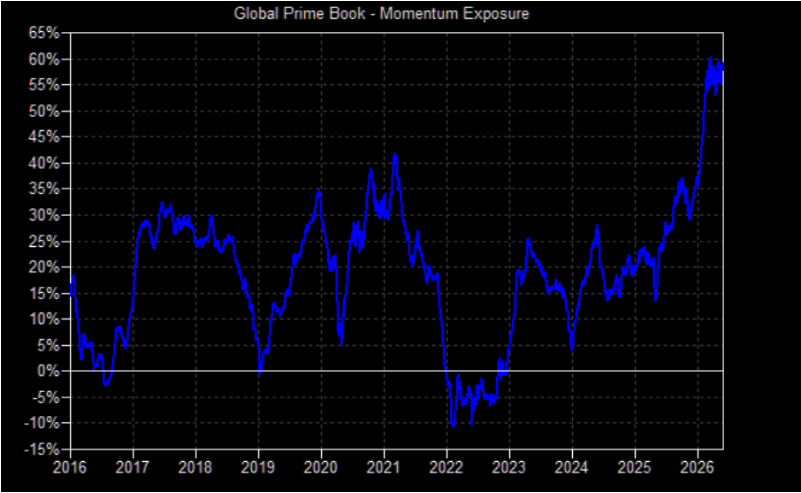
Momentum Exposure.
GS Prime: "Exposure to ‘momentum’ within our global Prime book is at record all-time highs, 50% greater than the prior highs set in 2021"