I track AI, neoclouds, chips and space stocks the slow way: filings first, then price data, then my own math.
Here is one example of the work. I ranked the 20 fastest growing companies in the S&P 500 by latest quarter revenue growth versus the year ago quarter, from SEC filings; Micron Q4 is derived as fiscal year minus nine months. Next to each name you see how far it sits below its 52-week closing high and how much it has bounced since the AI-crash low, at the Nov 10, 2026 close.
What it tells you: strong growth and a strong chart are not the same thing. 9 of these 20 names still trade at least 30% below their 52-week closing highs. Chased marks a name that has already run at least 8% since the Nov 6, 2026 close.
Expect more cards like this, earnings checks against the filings, and my own read when I have one.
Foxconn grew revenue 46% and still kept under 3 cents of every dollar as profit. So the rack boom is real, but the margin sits upstream with the chip designers. Funny week for it: analysts cut $NVDA on governance while its biggest assembler raises the outlook in all four segments. In my view orders and multiples are telling two different stories right now, and only the orders come with reported numbers...
Agree on the GPUs, less on 'back to normal'. Demand didn't vanish overnight, but four downgrades in one night tell me the multiple is being repriced, not the chips. My view: $NVDA can sell every GPU it makes and still trade at a governance discount until the board says who runs it. Demand fixes revenue, only a clear CEO answer fixes the multiple.
A flood looks plausible in plain DRAM, much less so in HBM, where yields are still the hard part even for the leaders. My view: the 2028 risk is real for commodity prices, but this market already panicked about CXMT once in October, and $MU still closed up about 12% yesterday. I start worrying when CXMT ships HBM in volume, not when it announces fabs.
Morning brief, Thursday 12.11.2026.
A bright close, then a thunderhead rolled in after dark.
$NVDA is the story. Shares closed up 2.9% at $173.73 on 11.11.2026, then ended after-hours trading at $158.76, down 8.6% from the regular close, following reports that the board is preparing to remove CEO Jensen Huang. The board met late Wednesday, and no decision has been announced so far. Before that, the Nasdaq Composite rose 1.6%. The S&P 500 also finished higher.
Futures and Asia: Nasdaq 100 and S&P 500 futures are lower. In Asia the Nikkei, the Kospi and the Hang Seng trade lower.
Earnings: $CRWV closed up 24.7% at $60.77 on 11.11.2026, the first session after its Q3 beat and raised 2026 outlook, then gave some of it back after hours as Nvidia fell.
My watchlist: $MU rose 11.9% to $811.30 on 11.11.2026 as memory names rallied. $NBIS reports Q3 before the open today, 12.11.2026. $NVDA reports Q3 on 17.11.2026.
My read: the rally was real, the storm is about one chair, not about demand. I watch whether the rest of AI stays dry when Nvidia opens...
One more for your list: whether $NBIS keeps the low end of its 2026 revenue guide. First half came in near $1B, so hitting that low end needs roughly twice as much in the second half. My view: a range that survives today uncut tells me more than any 2027 ARR headline. A 2027 number is easier to promise than a 2026 one is to hit.
What stands out to me: customers kept signing $RKLB Neutron contracts for a rocket that has not flown yet, even after the base price went from $55 million to $70 million. I think that pricing power outweighs the slip into next year, as long as the first flight does not move again. A second delay is where I would start reading the backlog as patience rather than confidence.
@TradeEchoApp Agreed, that's the line I'll watch too. Do you see interest expense peaking in 2027 as the new capacity starts paying, or does it keep climbing with the build? $CRWV
CoreWeave's sales surged. Its interest bill still dwarfs operating profit. $CRWV
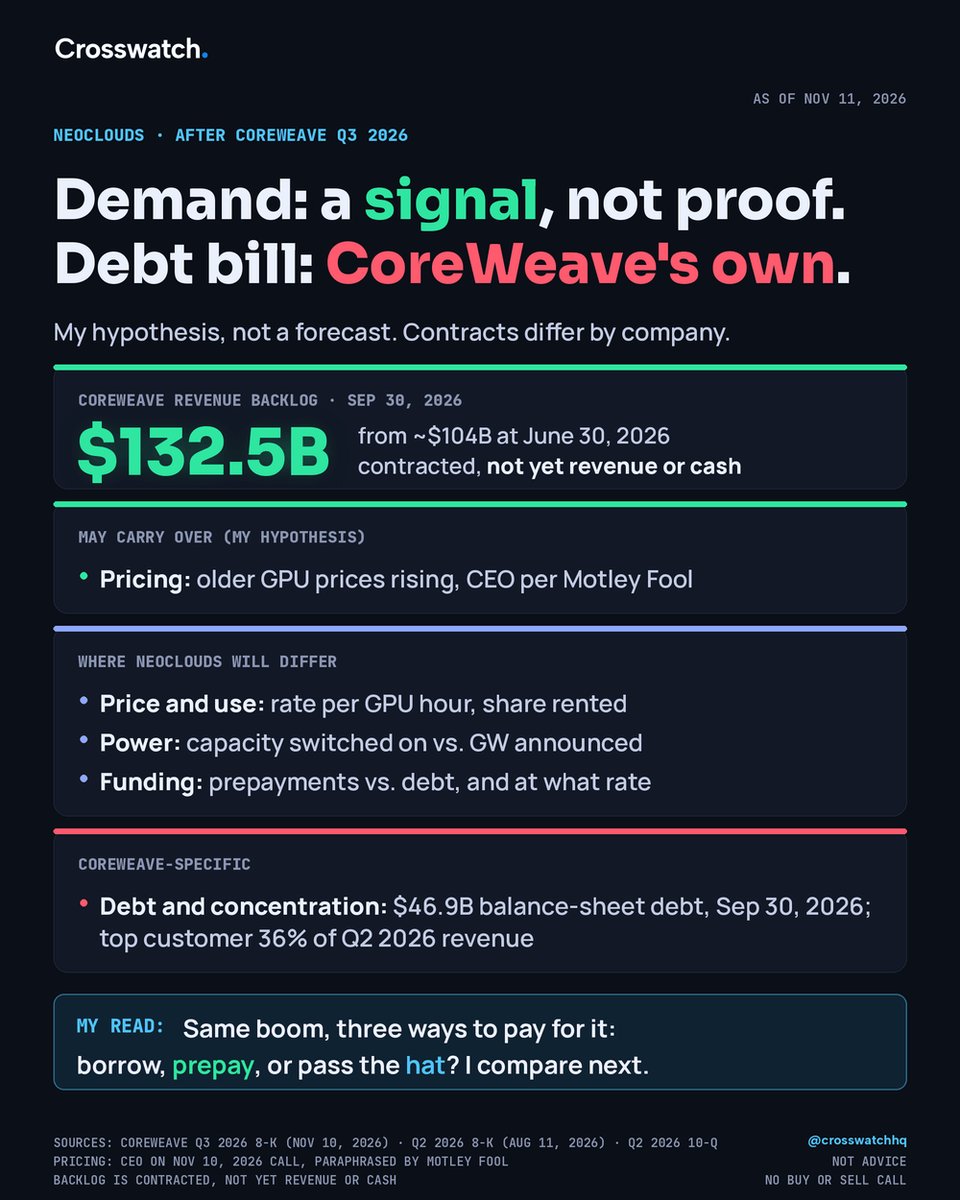
For me, that is a strong demand signal, not proof every neocloud has customers for its capacity.
Three months to Sep 30, 2026:• Revenue $3.66B, up 168% from a year earlier.• GAAP operating income $207M.• GAAP net interest expense $846M, about 4x operating income (about 2.2x adjusted operating income). CoreWeave reports this line net of capitalized interest, per its Q2 2026 10-Q. The Q3 10-Q is not out yet, so the capitalized part and the gross Q3 figure are unknown.• Backlog about $132.5B, up from about $104B at June 30, 2026. Contracted, not yet revenue or cash.
How the press read it: CNBC's Jordan Novet wrote that demand for AI infrastructure "remains strong despite concerns of a market slowdown." Joe Tigay of Equity Armor Investments told CNBC by email: "Strong demand is encouraging; the cost and availability of capital remain critical." At the Motley Fool, Jeremy Bowman wrote that the report "didn't show it was turning the corner on its balance sheet risk yet."
For other neoclouds, the demand signal may carry over. The outcome depends on four things that differ by company: the price per GPU hour, how much capacity is actually rented, how much power is really switched on, and what the money costs. CoreWeave's $46.9B of debt at Sep 30, 2026 and a top customer at 36% of Q2 2026 revenue are its own.
Nebius reports on Nov 12, 2026, before the US open. I don't treat it as a winner in advance. I'll read funding first: the over $9B of customer prepayments it expected for 2026, and the $3.5B Citi bridge loan due Oct 16, 2027. Its $3.0B ARR at the end of June 2026 is a run rate, not booked revenue.
IREN already reported on Nov 5, 2026, and runs a different model, so I don't carry CoreWeave's risks over to it. IREN says $9B of its $15B remaining planned capex for the fiscal year to June 2027 is covered by cash, committed GPU financing and prepayments. The other $6B still has to be raised.
My read: I give more weight to how expansion is funded than to revenue growth alone. Customer prepayments can reduce borrowing needs, but they also commit the provider to delivering the capacity.
CoreWeave showed the growth. Now I want to know who gets to keep the money. With Nebius next, I’ll compare how these neoclouds pay for the AI boom: borrow it, get customers to pay upfront, or pass shareholders the hat. I’d rather own part of the business than become its emergency ATM.
I read the low P/E the other way. When you posted $SNDK at about 9.8 times in September the stock was near 1,800. It is near 1,000 now and the multiple got cheaper, not richer. In memory I think a single-digit P/E on annualized peak quarters is the market pricing the cycle turn, so I care more about whether contract prices keep rising than about the multiple.
Good question. Stock-based compensation expense is not the same thing as shares sold into the market.
In the first half of 2026, Hims booked $79 million of SBC expense on $1.36 billion of revenue, about 6%. That matches 2025, when SBC was $135 million on about $2.35 billion of revenue. Against a market cap of about $5.3 billion, the first-half expense is about 1.5% of the company. A full year at that pace would be around 3%. That is a real cost to owners. It is not an astronomical share of the market cap.
What actually reaches employees is smaller than the headline. In the first half, 5.7 million RSUs vested. The company withheld 2.3 million of those for taxes, so those shares never hit the tape. About 3.4 million net shares went to employees. Option exercises added another 2.3 million, plus a smaller employee stock purchase issuance. All in, the share count rose from 227.2 million at the end of 2025 to 233.3 million on June 30, about 2.7% in six months. The first quarter was chunkier because 2.2 million performance RSUs vested after a 200% payout on 2025 targets.
That drip can make a short squeeze harder, because vest dates sit on a public calendar (now February 15, May 15, August 15, and November 15) and some employees do sell. It does not give shorts unlimited ammunition. A more typical quarter of net RSU shares is about 1.2 million, against a 53.5 million share short book and roughly 11 million shares of normal daily volume.
I cannot see from the filings how many of those net shares were sold in the open market. I can say the dilution is a genuine issue for holders, and it is not large enough, on its own, to fund or explain a 25% short book.
@italianinvesto Nice catch! Saw your March post wondering about the mystery client, then the June pitch. How did Singulus first land on your radar? $SNG
Scoring it like a blind follower is a brave test. Your own table says more: $OUST, $POET, $MRVL and Hynix made more than the whole profit on their own, while the other ten buys lost money as a group. I think that is the real lesson for copiers: the result lives in a few winners, so skipping one of them changes most of the outcome.
@realACollins Agreed, revenue spreading across more customers is the cleanest signal. I'd watch customer concentration in the next filings before adding. Thanks for the thoughtful thread, Andrew.
Double counting is exactly why I read commitments by how firm they are, not by the headline. Anthropic's amended S-1 lists about $895 billion of compute commitments, and roughly $214 billion of that can be terminated or depends on the other side getting financing. That is close to a quarter. When the same capacity sits in a lab's commitments, a neocloud's backlog and a chip vendor's guidance at once, the soft quarter is where the overlap hides. My threshold: if the firm share rises in the next filing, the demand is real. If it slips, Altman's warning gets bigger.
@HugoTheHoss@AlesInvests@spcxGOD Compute can remain scarce while customers gain more options. My point was about pricing power, not whether demand disappears. What makes you confident today's bargaining power lasts through 2029?
Slowing to about 40% is still enormous, so to me this is a call on the second derivative, not on demand. I think the direction is right: Alphabet already spent more on capex than it made from operations in Q2, roughly $45B against $39B. Once spend outruns cash, growth has to cool or the funding mix shifts toward debt. For $NVDA that reads as pressure on the multiple even while revenue keeps climbing...
Singulus stock jumped about 50% after one SpaceX order. Basis: €12.70 Xetra close on Nov 10, 2026, to €19.00 first Tradegate trade on Nov 11, 2026. Two venues, not one overnight move.
So what is behind the jump, and what has to happen for it to last?
Singulus, a machine maker from Kahl am Main in Germany, will deliver a turnkey line that makes solar cells for SpaceX ($SPCX) satellites. Delivery is due in H1 2027.
That one line is worth over €60M. Singulus forecasts about €83M in sales for all of 2026. Signed is one line. More lines and the 100 GW scale are still plans.
SpaceX is also its lender, with about €52M of loans in March and October 2026.
My read: the order transforms the order book, not yet the profit. It pays off only if Singulus builds the line at a margin and gets paid on time. And with the same partner on both sides, as customer and creditor, a problem on one side can reach the other.
Jump on the SpaceX train to orbit, and your stock might take off too. Singulus just showed what that can look like. I’m looking for the next passenger.
Not sure the squeeze math holds for $NBIS. About a fifth of the float was short at the last official count, but days to cover sat near 2.5, so shorts can get out in a couple of sessions. To me tomorrow's report matters far more than positioning. A beat with the full-year targets intact does the work. A squeeze on its own fades fast.