“Mate, how do you actually use Volume profile or AMT when looking at a chart? Anything more I can learn?"
Ok guys, let's drop the whole framework with the hope that you may find interesting ideas to apply to your journey/trading. (❗️Brutal value below❗️)
Disclaimer: As always, everyone has a different style and the goal is not copying someone else's strategy but building a process that provides statistical advantage over time (after backtesting).
What works for me might not work for you depending on timeframe, goals and availability.
(Quite long post, if you're lazy skip it (but don't expect results/improvments)
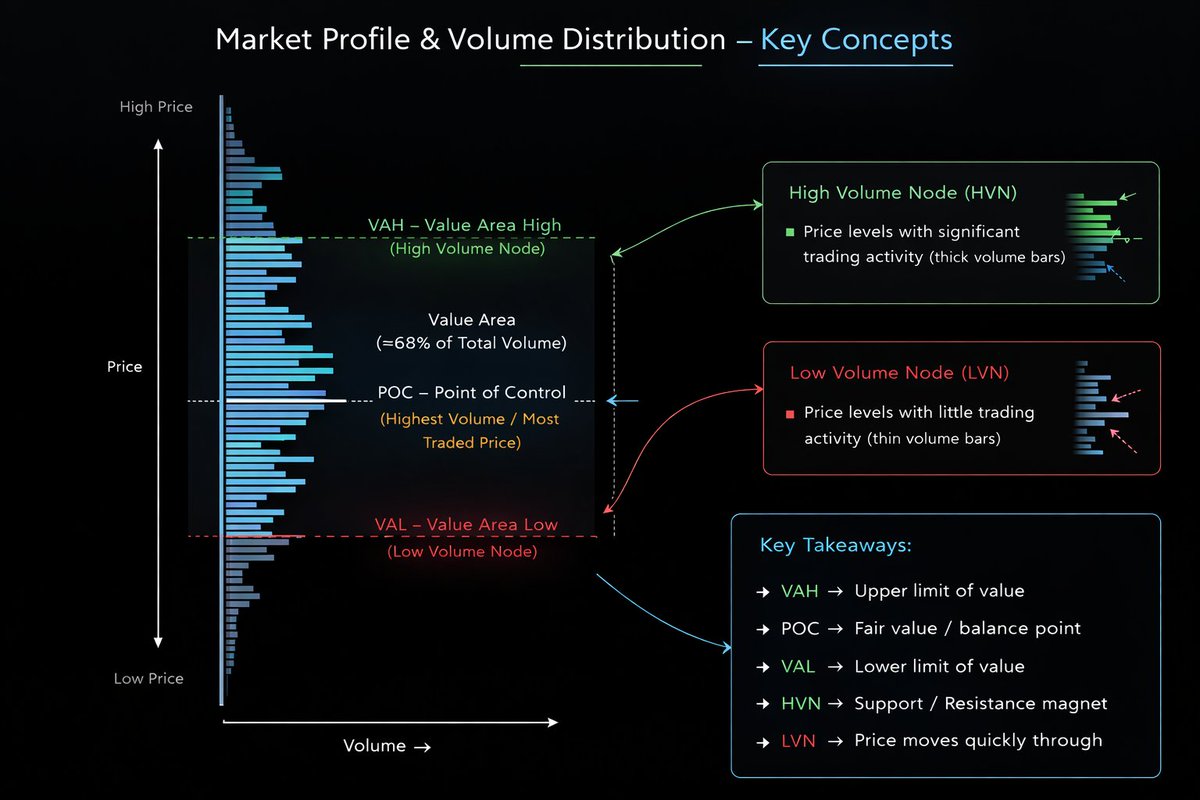
🔸 1st step -> Understanding what Volume Profile actually represents.
Volume Profile is simply the distribution of traded volume across price levels, not across time like traditional volume bars.
This allows you to see where the market actually accepted value and where it rejected it.
From a basic perspective, there are 3 important elements:
• POC (Point of Control) → the price with the most traded volume
• Value Area (VA) → where roughly 68/70% of the trading activity occurred (divided into VAH and VAL)
• High Volume Nodes (HVNs) → areas of acceptance
• Low Volume Nodes (LVNs) → areas of rejection or inefficiency
HVNs act like magnets for price because they represent equilibrium where buyers and sellers previously agreed on value.
I like to think, instead, about LVNs as "highways" where price tends to move quickly due to the lack of prior transactions.
Already here you can start understanding why the market often accelerates through certain areas and slows down around others.
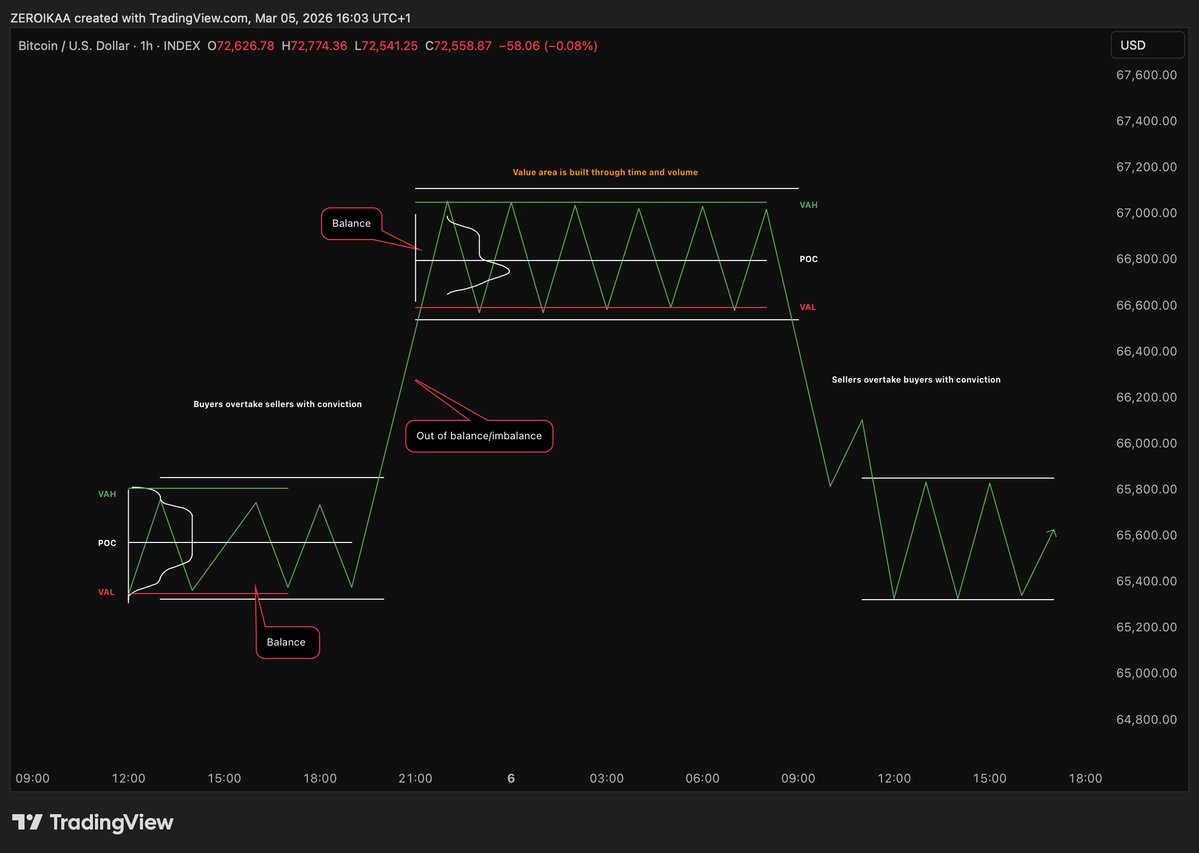
🔸2nd step -> Auction Market Theory
Markets are basically continuous auctions between buyers and sellers.
The market constantly asks a question:
“Is this price fair?”
- If participants accept the price → the market builds value.
- If participants reject the price → the market moves to find a new fair value.
This creates 2 fundamental environments:
- Balance (equilibrium)
Price rotates inside value areas and HVNs.
- Imbalance (discovery)
Price leaves value and searches for a new fair value.
Recognizing when the market is balancing vs discovering is one of the most simple yet powerful concepts in trading.
If the market is balanced → expect rotations.
If the market is imbalanced → expect continuation.
🔸 3rd step -> reading the shape of the profile
This is something that usually gets unnoticed.
Volume profiles often form recognizable structures:
• D-shaped profile → balanced market, rotation
• P-shaped profile → short covering -> bullish continuation
• b-shaped profile → long liquidation -> bearish continuation
• Double distribution → market transitioning between 2 value areas
The shape of the volume tells you what's happening in the auction.
"Eh? What do you mean?"
For example:
A P-shaped profile has higher probability of appearing after aggressive short liquidations where the market rallies and then builds value at the top -> based on context it's a bullish sign -> why? -> If the market holds the upper value area, it suggests that after shorts were squeezed, new buyers are accepting higher prices.
A b-shaped profile usually appears after longs get trapped and forced to exit -> based on context it's a bearish sign -< why? -> If the market accepts lower prices after the liquidation, it suggests new sellers are active, not just liquidation.
These structures help you understand who is trapped and where liquidity might sit, forming a bias.
🔸4th step -> Identifying volume voids
One of the most powerful concepts is the Volume Void.
These are areas where very little volume was traded.
Because the market previously rejected those prices quickly, when price re-enters these zones it often moves very fast.
You will see tht volume voids frequently align with:
• FVGs
• Impulsive candles
• Liquidity sweeps
When multiple inefficiencies overlap, the probability of fast price movement increases significantly, so you can use them to your own advantage.
🔸 5th step -> Value migration
Another key AMT concept is observing how value shifts over time.
- If the POC and value area move higher, the market is accepting higher prices → bullish context.
- If value migrates lower, the market is accepting lower prices → bearish context.
In this GBP/USD example I made you can clearly see the migration of value + the concepts explained.
However, in my experience the real edge comes when price moves away from value too aggressively.
Markets tend to revisit previous value areas because auctions like to rebalance unfinished business.
That's why many large moves eventually retrace toward prior POCs or HVNs.
🔸Sixth step -> Combining VP with price action
Volume Profile alone is not enough, nor it will ever be.
It becomes powerful when combined with:
• S&D zones
• Liquidity pools
• MS (HH/HL or LH/LL)
• FVGs or inefficiencies
Example:
Price sweeps liquidity above a swing high → enters a LVN → rejects from a HTF supply zone.
That confluence creates a much stronger trade idea than using any single tool, in my experience.
The profile simply provides context about where the auction is strong or weak.
🔸 Seventh step -> Execution
The most important step, isn't it?
Once the levels are mapped, I usually monitor:
• Reactions at HVNs or POCs
• Fast moves through LVNs
• Acceptance or rejection outside value areas
• Value area shifts
- If price re-enters value after a breakout, there's a high probability of a rotation across the value area.
- If price accepts above or below value, the market has a higher probability for starting a new auction.
Based on this I plan my longs and my shorts but also (and that's probably the most important part) I adjust the stop loss in a dynamic manner, meaning that I wait for the price to test and to be rejected from a value area before moving my stop depending on my bias (long🔼 or short 🔽)
That’s basically the framework I use when incorporating Volume Profile and AMT into my analysis.
It's pretty much logical that you need time to assimilate these concepts, but to me and for my style they're the best I can use, so I highly encourage you to study them.
They don't replace price action, but they reveal the structure of the auction behind it, which is 🔑
As always, if you found this helpful, the like and repost buttons are just a few centimeters below.
One of the best paragraph I ever read and that is still printed in my mind:
"Trading is an art that is learned not by adding something to one’s knowledge, but by removing something from one’s nature.
Waiting, for a trader, is the most refined and difficult form of action to master.
To wait and to do nothing are two very different things, within waiting lies opportunity.
In the time “wasted” waiting, the mindset of a true trader is forged.
Waiting is not for everyone, only those who have understood that trading is also a patient hunt, waiting for the prey to stick its nose out of the den, are capable of “wasting” time wisely.
Boredom is a treacherous sidekick of the ego, an apparently harmless ally, yet one that ensnares the minds of many traders.
Lurking, like a cat, scanning for opportunities: it’s a concept universally accepted in theory, but practically ignored by a vast number of aspiring traders.
Doing nothing and waiting are two very different things.
Observing patiently, awaiting the right moment, is boring, very boring.
Opportunities will be missed.
But that is the price to pay to avoid unexpected setbacks, ones that often stem from a small trade made to escape boredom or to chase the latest “trend” everyone is talking about."
In a space obsessed with what's new, it's easy to dismiss the older coins in the crypto market as relics of a past cycle, but if you ignore the fundamentals and focus purely on price action, these so-called "dinosaurs" start to look more like survivors.
Coins like LTC, BCH, ETC, XRP, DOGE, XLM, and even legacy names like ZEC or DASH have something newer coins don’t: a footprint.
Years of trading history mean well-defined ranges, HTF supplies and demand that actually matter, and deep liquidity that attracts real capital, especially when volatility picks up.
Smart money don't chase hype contrary to retails.
They accumulates in silence, within inefficiencies, in the corners of the market the crowd has stopped watching.
That’s where old coins come in.
They’ve already been fully distributed and the exit liquidity cycles have already played out, often multiple times.
That’s why when they base for months, it’s not a coincidence.
It’s structured, intentional and you can see the quiet grind of re-accumulation in the volume profile and in the absorption in the order books.
These coins are battle-tested.
They’ve been through 80–95% drawdowns, coordinated exchange delistings, SEC lawsuits and, probably most important, narrative extinction.
Yet, they remain listed on every major exchange, with sufficient depth to support large positions, and this matters.
When smart money need exposure with minimized slippage, they don't ape into illiquid microcaps, they rotate into legacy names with structure.
The psychology is just as important.
Old coins have what you might call “chart memory.”
Every retail trader remembers when XRP hit $3, or when DOGE melted faces in 2021, right?
That history builds reactive zones, areas of sudden interest when momentum returns.
They don’t need new fancy whitepapers or tokenomics.
All they need is volatility, because when the tide rises, reflexivity does the rest.
Take ETC for example.
It seemingly has no use case advantage over ETH, and yet it remains resilient, why?
Because it’s been priced, repriced, and repositioned across multiple macro conditions.
BCH still shows strength during certain market phases, not because of narrative, but because its market structure is reliable.
Same with XLM, laggard in the rallies, but always one vertical candle away from catching attention again.
Even names like ZEC and DASH, which feel forgotten, continue to trade..maybe thinly, perhaps, but with just enough energy to suggest that someone, somewhere, is keeping them on a rotation watchlist.
These aren’t random pumps.
They’re part of a longer game: reversion to mean, short squeezes, liquidity grabs..all part of the playbook.
If you study price action instead of headlines, you'll notice a pattern: these coins aren’t being bought out of belief, they’re being traded, and that alone gives them a kind of staying power newer projects haven’t earned yet. (and some will never)
They’ve been flushed, forgotten and yet they remain.
This is not death, but dormancy.
For the next years, make a list with at least 3/5 legacy names to include in your purchases.
Watch for extreme discount levels, accumulate/build long positions and you're likely gonna enjoy a nice show.
BADA-BING, BADA-BOOM 💥
Today I would like to share some observations I have spotted on BV0L24H.
I analysed the past 1 Year of BTCs 24H volatility data, and found that over the past 53 weeks, a low was put in on Sunday 46 times, compared to only 5 times for Saturday and 2 times for Monday. In other words, the probability BV0L24H will reset on a Sunday is 86.8%, while being only 9.4% & 3.8% for Saturday and Monday.
While obvious that this could not be mere chance, I tested its statistical significance at the 1% level, with the null hypothesis H₀ being: 'probability of landing on a Sunday is p₀ = 1/7 (0.1429)'
With a Z-statistic of 15.08, the P-value was essentially zero (much less than 0.0001), confirming the results are statistically significant and ruling out any 'chance' that this observation was by random.
Next, I wanted to see if this insight could give me any extra edge, so I mapped the volatility lows (coloured arrows) to BTCs chart, and proceeded to measure the percentage swing of BTCs moves until the local swing low/high was reached in the period T to T+1, which is the period until volatility resets. In a rather crude manor, using the 1D time frame, I simply measured the low/high of BTCs candle corresponding the volatility low, until the swing low/high within the period T to T+1.
Directionality was favoured by the largest percentage swing in the period. Below is sample for how I measured BTCs price movement. As a quick disclaimer, I would not trade this blindly, but pair this info with liquidity levels (for the retarded homies).
From initial observations, it looks promising. Using this information, we can better estimate when BTCs volatility will likely start and end, which in turn can help us make better trading decisions and better forecasting of the market, since BTC controls most the liquidity.
Possible Edges 🎯
☞ Depending on which fuel (long/short) BTC took while heading into volatility reset, can position accordingly to profit from move
☞ Protect open positions (SL2BE or stops in profit) if unsure of expected volatilities direction
☞ Avoid countertrend trading on Saturday and Sunday (more applicable to swings) just before projected volatility spike
I am currently analysing MTFs on 24H volatility, to see if I can refine this edge and 'predict' to a greater degree when the volatility reset is over.
Below is some refined data on BTCs 24H volatility for the serious homies ;) 📝
Initially, my reasoning for Sundays volatility low was due to lower trading volumes on the weekend causing less movement. However, digging into when the volatility spike occurred, many times this actually happened during Sunday, with the volatility low being formed very early hours of Sunday. Besides, with most trading volumes being algorithmic, this argument doesn't really make sense to me anymore.
I am still not sure of the reason. Anyways, to what extent does this illustrate the algorithmic architecture of markets? Is it connected, or separate? Does this 24H volatility data illustrate that algorithms cyclically move BTC - and we are seeing this footprint? 💭
For those interested, here is a picture of the full dataset. I am more than happy to collaborate with any excel wizards that think they can squeeze more insight out this data - my excel skills are rather rudimentary. Would also be cool seeing the dataset expanded over a bigger sample size, or any new metrics added. Ping me a DM if your up for giving it a bash - ill send you the raw data.
BTC Funding & Open Interest — HTF Analysis
When it comes to developing a solid HTF outlook, funding rates can offer powerful insights, if you know how to read them correctly.
In every key instance I’ve marked, funding provided clear directional signals. Out of all the setups, only one failed and it’s important to understand why.
In that case, we were already deep in a bear market and had broken structure to the downside. Context matters.
Now compare that to the current structure:
We haven’t broken down. In fact, we've formed a higher high and higher low on the HTF.
Judge for yourself.
⚠️ VOLATILITY ⚠️
Volatility is a blessing in trading markets as it creates more trading opportunities, which gives you the chance to be profitable in both directions instead of just one.
The crypto market creates the most volatility compared to other markets, hence why you will see more opportunities to profit in that market. Volatility can be bullish and bearish, but it is more visible in a downtrend due to ⚡️ wicks and fearful emotions.
There is higher volatility in the LTFs compared to the HTFs.
Volatility typically spikes during uncertainty (fear) and satisfaction (greed), which drives volatility in the markets. You can also expect volatility to occur when major news is released or during/after a major real-world event. For example, FOMC meetings (CPI & IRs) and presidential elections (Something that affects the majority of people). Rapid movements in price are the perfect excuse for exchanges to ❄️ their services, stopping people from transferring money or executing trades. The combination of a ⚡️ and a ❄️ is a good major reversal signal, as this tends to happen at most local bottoms.
To find out the FOMC dates, you can use this website 👉 https://t.co/qvMuu7lbKt
To find out news that can affect certain currencies, you can use this website 👉 https://t.co/B3HzvHVWVJ
Fear & Greed Index
During high volatility, you could use the fear and greed index to get an understanding of the current sentiment from the herd. In extreme greed, we sell. In extreme fear, we buy. Contrary to what the herd is thinking, as they are wrong most of the time. When the index is at ~20 or lower (Extreme fear), this could mean it's a good time to buy. When the index is at ~80 or higher (Extreme greed), this could mean it's a good time to sell.
Use this CMC to monitor the index 👉 https://t.co/35rNmsvkw3
Price action
If a significant swing occurs before taking any major HTF liquidity, there is a higher chance of experiencing high volatility in the future. Meaning after taking significant fuel from the powerful swing, a ⚡️ reversal is likely (sharp movement or ⚡️ wicks).
High volatility at tops will rarely show a fast wick, as MMs want to trap retail money and make the trap as invisible as possible. A 3-drive pattern will likely show on Bitcoin at local tops, as this shows MMs absorbing heavy buy orders by offloading their bags. A failed BOS will likely occur afterwards, as there isn't enough liquidity to push the market higher. However, the market structure and these patterns will be covered by the bullish sentiment/news that they'll constantly be releasing. Your job is to use that as a confluence while identifying those patterns to validate your decision further.
In ⚡️ wick scenarios, assume altcoins to do double the percentage drop of Bitcoin. For example, if Bitcoin is -15% away from its key level, I assume altcoins will drop ~30%. The higher the market cap, the lower the percentage drop, meaning I would expect a -20% to -25%. The game isn't linear, so there isn't a definitive answer as key levels will lie at different areas showing a higher or lower percentage drop but if Bitcoin is due to drop rapidly to a key level that is -15% away, then you shouldn't be looking at a key level on a different coin that is -15% away or lower as PA is likely to drop down even further.
During high volatility, it may be best for newer traders to ignore such days, as timing/experience has to be top notch. Price action will hunt for those SLs and newer traders will most likely be left in confusion as their trades ended up working, but they got liquidated beforehand. Experience, knowing how to time and manage your trades is the only solution to overcome this barrier.
Watch the high volatility on your setups during these sessions a couple of times, and then get involved to have a feel of the volatility and learn from your setups.
THIS TAKES TIME! MANY OF YOU WANT TO FIND THE SOLUTION ASAP. EXPERIENCE THE SCENARIO A COUPLE OF TIMES, THEN ASK QUESTIONS LATER.
Whales like to build narratives and intensify the current sentiment to create extreme volatility to their means. They will typically release such narratives/sentiment as price action approaches or at a significant key level. This helps MMs to send price action to key levels faster, as it becomes the perfect excuse that retail traders normally blame. Treat it as a pre-scheduled move. Powerful reversals will always be marked by high volatility.
SEC news and FUD will most likely send many large caps to their key levels before a bullish reversal. Other altcoins may soon follow into their key levels too. Although the timing may not be simultaneous, this can often be a good signal of a bullish reversal, as most high-cap coins have taken their HTF key levels.
There will only be bullish news at local tops.
There will only be bearish news at local bottoms.
MoneyTaur - "When high volatility kicks in, be ready for the reversal, waiting at the right levels, and when those levels hit, you execute!"
Weekends tend to involve lower volume. Therefore, it doesn't take much for MMs to send price action to key levels faster. The crypto market is open all day, every day and there is always volatility.
Volatility = Opportunities
Charts that can be used to measure volatility:
▫️ VIX
▫️ BVOL
▫️ BVOL7D
▫️ BVOL 24H
VIX - The VIX chart measures stock market volatility and reflects sentiment/uncertainty in the market. When it spikes upwards, people become nervous because of big price swings. When it goes down, people become calm because of smaller price swings.
When it spikes upwards (above ~36), I use this as a confluence for a reversal (typically a bullish reversal).
BVOL - The BVOL chart measures Bitcoin's volatility and can reflect the sentiment in the market. When it hits support/resistance, it means high volatility will kick in. When PA leaves the support/resistance zone, that's when the reversal happens (Support zone between 15.08 - 12.55 and 10.87 - 7.87. Resistance zone between 26.08 - 28.67 and 45.41 - 50.98, at this given time).
When the BVOL chart is at support/resistance and Bitcoin is at/near a HTF key level, assume that will be the reversal point. The answer to the direction can be found on Bitcoin's PA and will typically be a bigger reversal than usual.
BVOL7D - When price action hits support, volatility kicks in shortly after (Support zone between 4.73 - 3.61 and 2.71 - 1.75).
BVOL24H - When price action hits support, volatility kicks in shortly after (Support zone between 1.33 - 0.23).
Cross-check major events with these charts' behaviour to get an idea of when volatility will kick-in to key liquidity levels. Your job is to find out the direction with the highest probability.
Quadruple Witching
Quadruple witching can also be a good reason to expect some volatility. This occurs when four different types of financial instruments expire simultaneously on the 3rd Friday of March, June, September and December.
The simultaneous expiration of these contracts can lead to increased trading volume and volatility as traders and investors adjust or close out their positions, so keep an 👁️ on those dates.
Cumulative Volume Delta (CVD)
CVD is a tool used in order flow and volume analysis to understand who is in control of the market (buyers or sellers) based on market orders.
When CVD is going up, that shows aggressive buying.
When CVD is going down, that shows aggressive selling.
CVD Divergence
Exhaustion
When price action is showing lower lows while CVD is showing higher lows, this indicates a lack of participation from sellers, and price could potentially reverse to the upside.
When price action is showing higher highs while CVD is showing lower highs, this indicates a lack of participation from buyers, and price could potentially reverse to the downside.
Exhaustion shows that the market is losing momentum, and the price may reverse because one side is running out of fuel.
Absorption
When price action is showing lower highs while CVD is showing higher highs, this indicates that the aggressive buyers are active and are being absorbed by the passive sellers. Buyers become trapped, leading to a potential move downwards.
When price action is showing higher lows while CVD is showing lower lows, this indicates that the aggressive sellers are active and are being absorbed by the passive buyers. Sellers become trapped, leading to a potential move upwards.
Absorption shows that one side is aggressively attacking, but is getting absorbed by large limit orders (trapped and squeezed).
Funding Rates
Funding rates are periodic payments between traders who are long and short on perpetual future contracts. They exist to keep their prices close to the spot price of the asset, such as BTC, ETH or XRP. Funding rates are a tool to balance demand between long and short positions. When the funding rate is overly negative, that means people are overly long (there are a lot more longs paying shorts) and vice versa.
A high positive funding rate when the market is on a downtrend indicates that bulls are being squeezed, which is bearish. If the funding rate becomes more positive as the price goes lower, this shows aggressive perpetual buyers or big spot selling.
A high negative funding rate when the market is on an uptrend indicates that bears are being squeezed, which is bullish. If the funding rate becomes more negative as the price goes higher, this shows aggressive short interest or big spot buys.
A neutral funding rate (close to 0) shows that the market is in equilibrium, meaning longs and shorts are balanced (perpetual futures price is close to the spot price). There is no strong bias in the current situation.
Big breakouts often happen after periods of low funding and low volatility.
Open Interest
Open interest helps indicate the level of market activity and investor interest in a specific asset. Are new future positions being opened, or are existing positions being closed?
When the open interest and the funding rate sharply increase, this tells us that buyers are aggressively long on futures. If the long side becomes overcrowded, the market is at risk of a long squeeze (sharp move down), potentially liquidating longs despite a valid long setup.
When the open interest is increasing and the funding rate sharply decreases, this tells us that sellers are aggressively short on futures. Even if you have a valid short setup, aggressive shorting could cause a crowded trade, increasing the risk of a squeeze upward that liquidates shorts.
When the open interest is falling with the funding rate decreasing, this tells us that long positions are likely closing, and the bearish sentiment remains strong.
When the open interest is falling with the funding rate increasing, this tells us that long positions are likely closing, but the market still shows long pressure due to shorts covering or late longs are trapped/squeezed.
You can use open interest and funding rates together to gain a better understanding of the aggression in the price action.
Use this website to monitor the funding rates and open interest 👉 https://t.co/C0Ku5ciawj
Using volume can help you understand even further how strong the move is, helping towards validating or invalidating a setup. You can check out that post here 👉 https://t.co/OsssoGnzMI
I try to make these topics as friendly as possible and it does take some time out of my day, so if you want me to provide more educational posts, please follow, like and repost so they can reach more people 🙏.
If you have any questions, put them in the comments below 👇.
Obsidian Basics 🔤
When first installing Obsidian, it can be pretty over whelming to figure out how the platform works, let alone working out the best way to organise your @MoneyTaur_ content. To get up to speed, I would strongly recommend watching this free Obsidian mastery course available on YouTube, which is the most systematic & beginner friendly course i've come across: https://t.co/8V9EfqI0Ik
In a nut shell, the best way to use Obsidian is to just start and figure out how it works as you go. Don't worry about excessive organisation using folders/links/tags from the get go, dump all your content into it, then organise it later. The beauty of Obsidian lies in directly linking/back-linking notes to form a 'brain like' web of knowledge that allows deeper learning than traditional folder based note systems.
However, in saying that, I struggled to quickly adopt the markdown syntax rules for writing, and would not have got to grips with the platform as quickly as I have without these essential plugins:
1. 'Paste URL into selection' (Denis) 💎
☞ Allows you to paste links directly onto text like in Notion
2. 'Editing toolbar' (Cuman) 💎
☞ Gives you a toolbar similar to word to easily edit and format text the way you like. (Add custom keyboard hotkeys to increase your efficiency 📝)
3. 'Coloured Text' (Erinc)
☞ Allows you to colour text with custom colours to make key info stand out
4. 'Recent Files' (Tony)
☞ Have a history tab to see notes you recently opened
5. 'Image Toolkit' (sissilab) 💎
☞ Allows you to click on images like MT charts in your notes to zoom into them. (Use the invert colours button to see hidden/barely visible fib levels or text on MTs charts 🎁)
6. 'Settings Search' (Jeremy)
☞ Adds a global search settings bar into settings menu
7. 'Emoji Shortcodes' (phibr0)
☞ Can use markdown emoji shortcodes like ':bullseye' to return 🎯 to save time
Non essential but good plugins:
8. 'Calendar' & 'Periodic Notes' (Both by Liam Cain)
☞ Calendar widget; click on a day to see your daily journal for that trading day. Periodic notes allow you to create weekly and monthly notes as reviews.
9. 'Iconize' (Florian)
☞ Add icons or emojis to files, folders and text (similar to Notion)
10. 'Homepage' (novov)
☞ Adds a homepage button that returns you to your chosen note as home (useful after you have set up your maps of content 📝)
11. 'Natural Language Dates' (Argentina)
☞ Insert timestamps and cross link your daily notes using natural language, like '@today' to return 2024-10-13
12. 'Importer' (Obsidian) 💎
☞ If you want to import all your previous notes from Notion, Evernote, Apple Notes, Microsoft OneNote, Google Keep, Bear, Roam or HTML files, use this plugin to switch.
However, if you only have a small amount of notes (<50), I would import them manually as it gives you a chance to revise your MT content and find new 🎁
If your still on the fence about switching to #Obsidian, check out my previous post here: https://t.co/MTOnVXbPLF
Pay attention to mining companies for assessing potential local or macro BTC tops.
When HTF supply zones start appearing on charts of miners like MARA, RIOT, CLSK, HIVE and more, it’s not something that happens by chance.
It's a reflection of deeper moves happening in the market, aka the beginning of a shift that most won't notice until it's already too late.
Mining companies are tightly linked to Bitcoin’s fate.
Their entire business depends on Bitcoin's price staying strong, and because of that, they are among the first to feel when the market’s strength is starting to fade.
The presence of heavy supply on these mining companies' charts usually signals that smart money (not only the classic smart money type but also people with better access to internal data, real-time network conditions, and mining profitability metrics) have started exiting.
Logically, It doesn’t happen with panic, but through calculated selling into strength, hidden in what looks like normal market behavior.
They sell when retail buyers are still convinced the rally will continue.
When a miner's stock struggles under a supply zone, especially after a major rally, it’s a clear sign that confidence from serious players is likely gone.
Even if Bitcoin’s price continues to move higher for a while, the miners’ weakness tells a different story: the rally is running on borrowed time.
Miners therefore, often act as an early warning signal.
Their stocks often turn before Bitcoin itself, showing stress while BTC still looks "healthy" on the surface.
If you watch closely, you’ll often find these supply zones/distributive models forming just before Bitcoin peaks locally or even enters a major top formation.
The miners' charts reflect the insider selling that’s already underway, something that doesn’t immediately show up in Bitcoin’s price because it takes time for the weaker hands to realize they are buying into distribution, not strength.
Bitcoin doesn’t usually crash out of nowhere.
The process starts quietly, also in these hidden layers.
When mining stocks show clear rejection at heavy supply areas, the signal is often already there: the big players are unloading, risk is rising, and the momentum that carried the market up is weakening.
By the time Bitcoin itself shows real weakness, the miners have already revealed it to anyone paying attention.
This is often a +1 crack in the structure, warning that the real top, whether local or larger, is already being shaped.
You'll also notice plenty of on-chain data popping out at the same time with "miners are accumulating, they aren't selling" which is of course a soft lie to make people believe that the trend "it's not gonna stop anytime soon" and this happens also because of the nature of this type of data: they're easy to read and could give the perception of knowing "what you're talking about".
Keep an eye open.
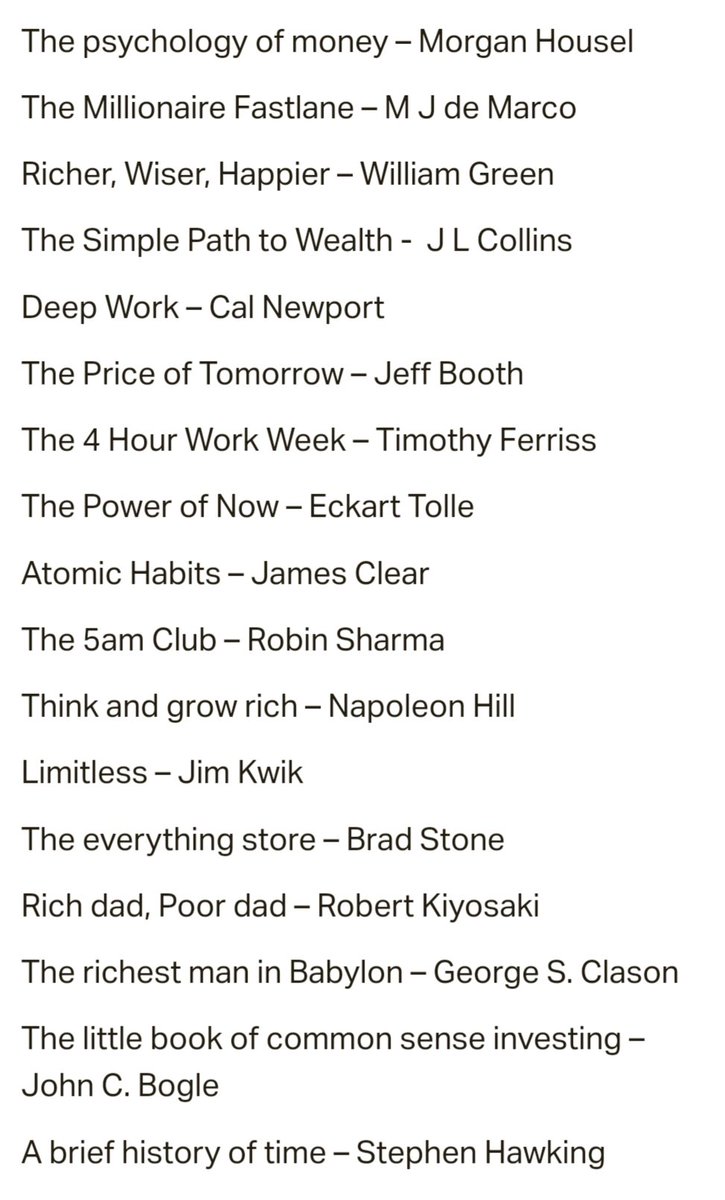
@FfbUnidentified Reading something is better than reading nothing but don't read just motivational books if you don't have the extra knowledge to take action with a much stronger mindset than the average.
Read these, blend everything together, take action, and be patient:
The 10 best books of all time, for someone interested in trading, personal development, entrepreneurship, and mindset mastery.
The mental game of trading
Atomic habits
Buy back your time
Trading in the zone
The psychology of money
Think and grow rich
Richer, Wiser, Happier
The 7 habits of highly effective people
The power of now
Ready, fire, aim: Zero to $100 million in no time flat.
❗️ Universal lessons. Actionable wisdom.
@CryptoElPres@WatcherGuru “Miners are accumulating”
“BTCs are leaving exchanges”
“Supply shock incoming”
“On-chain data says that we're about to run hard..”
Obsidian Basics 🔤
When first installing Obsidian, it can be pretty over whelming to figure out how the platform works, let alone working out the best way to organise your @MoneyTaur_ content. To get up to speed, I would strongly recommend watching this free Obsidian mastery course available on YouTube, which is the most systematic & beginner friendly course i've come across: https://t.co/8V9EfqI0Ik
In a nut shell, the best way to use Obsidian is to just start and figure out how it works as you go. Don't worry about excessive organisation using folders/links/tags from the get go, dump all your content into it, then organise it later. The beauty of Obsidian lies in directly linking/back-linking notes to form a 'brain like' web of knowledge that allows deeper learning than traditional folder based note systems.
However, in saying that, I struggled to quickly adopt the markdown syntax rules for writing, and would not have got to grips with the platform as quickly as I have without these essential plugins:
1. 'Paste URL into selection' (Denis) 💎
☞ Allows you to paste links directly onto text like in Notion
2. 'Editing toolbar' (Cuman) 💎
☞ Gives you a toolbar similar to word to easily edit and format text the way you like. (Add custom keyboard hotkeys to increase your efficiency 📝)
3. 'Coloured Text' (Erinc)
☞ Allows you to colour text with custom colours to make key info stand out
4. 'Recent Files' (Tony)
☞ Have a history tab to see notes you recently opened
5. 'Image Toolkit' (sissilab) 💎
☞ Allows you to click on images like MT charts in your notes to zoom into them. (Use the invert colours button to see hidden/barely visible fib levels or text on MTs charts 🎁)
6. 'Settings Search' (Jeremy)
☞ Adds a global search settings bar into settings menu
7. 'Emoji Shortcodes' (phibr0)
☞ Can use markdown emoji shortcodes like ':bullseye' to return 🎯 to save time
Non essential but good plugins:
8. 'Calendar' & 'Periodic Notes' (Both by Liam Cain)
☞ Calendar widget; click on a day to see your daily journal for that trading day. Periodic notes allow you to create weekly and monthly notes as reviews.
9. 'Iconize' (Florian)
☞ Add icons or emojis to files, folders and text (similar to Notion)
10. 'Homepage' (novov)
☞ Adds a homepage button that returns you to your chosen note as home (useful after you have set up your maps of content 📝)
11. 'Natural Language Dates' (Argentina)
☞ Insert timestamps and cross link your daily notes using natural language, like '@today' to return 2024-10-13
12. 'Importer' (Obsidian) 💎
☞ If you want to import all your previous notes from Notion, Evernote, Apple Notes, Microsoft OneNote, Google Keep, Bear, Roam or HTML files, use this plugin to switch.
However, if you only have a small amount of notes (<50), I would import them manually as it gives you a chance to revise your MT content and find new 🎁
If your still on the fence about switching to #Obsidian, check out my previous post here: https://t.co/MTOnVXbPLF
Obsidian Advanced Plugins ☯️
Here’s is my part 2 for the most based obsidian plugins I use. Take the time to learn how to use these properly; click the github links and read the community docs available.
Do your self a favour and invest a bit of time into building an efficient second brain to study MT and study your self - your thoughts and beliefs 👁️ - you will level up quickly in trading and life!
If your new here, check out the previous Obsidian posts
☞ Why Use Obsidian https://t.co/MTOnVXbPLF
☞ Basic Plugins https://t.co/fI8A7WNjkI
☞ Web Clipper https://t.co/U6pgvyJtrU
These plugins are the heavy weights and key building blocks
‘Dataview’ (Michael Brenan) 👑💎💎
☞ The must have plugin. Allows data variables you define to be extracted and manipulated from all of obsidian. Handles complex data queries; can use their simplified natural language to queries or use JS for full control (Use ChatGPT to do the heavy coding with JS 📝)
☞ I will be making a separate post just for dataview
☞ ‘Templater’ (Silent Void) 💎🧠
Create and use templates; can access via hotkeys, or allocate to certain folders. Build a powerful trade template and daily trading routine template; build once, zero effort using after. Combine dataviewjs queries to preload data you want to see.
☞ ‘Charts’ (phibr0) 💎
Allows you to create charts on obsidian to display trading metrics you track. Can use bar, line, pie, polar area and radar charts. Integrates with dataviews JavaScript API to allow full control of data manipulation/extraction.
‘DB Folder’ (RafaelGB) 💎🔥
☞ This is how you get notion style databases in obsidian. Great for excel like tables; can add custom formulas using JavaScript (use AI).
‘Heatmap Calendar’ (Richard Slettevoll)
☞ Visually view data. Activity Year Overview for DataviewJS; you can set variables to track via colour to see big picture. I have used it to measure trading performance: https://t.co/Jum4rUK0pH
Effective time-saving plugins
‘Commander’ (jsmorabito & phibr0)
☞ Customize your workspace by adding commands everywhere, create Macros and supercharge your mobile toolbar. Create hotkeys for different workflows or sections of obsidian.
‘Outliner’ (Viacheslav Slinko) ⚡️
☞ Work with your lists like in Workflowy or RoamResearch. Allows you to move bullet points up and down to quickly re arrange via hotkey without copy and paste.
‘Tag Wrangler’ (PJ Eby)
☞ Rename, merge, toggle, and search tags from the tag pane. For example could globally change the name of one hashtag in one step, instead of changing manually for each note.
‘Copilot’ (Logan Yang) 🔋
☞ Copilot for Obsidian is an open-source LLM interface right inside Obsidian. It has a minimalistic design and is straightforward to use. Have been testing it to use a strictly offline model in my obsidian database for privacy reasons; currently use CGPT desktop app and copy in. (S/O to @CryptoAyanokji who also recently mentioned it)
Other useful plugins with decent utility
‘Plugin Update Tracker’ (N/A) ⭐️
☞ Know when installed plugins have updates and evaluate the risk of upgrading. Has a neat upgrade icon notification to let you know when new versions of your plugins are launched and shows release notes of update.
‘Numerals’ (RyanC) 💎
☞ Turns a math code block into a full featured calculator. Evaluates math expressions on each line of a code block, including units, currency, and optional TeX rendering. I use for tracking my finances, and assets on different exchanges/wallets 🎁. Super neat and has an accounting vibe to it.
‘Solve’ (Liam Riddell)
☞ Another neat math plugin which does quick calculations ‘in line’ of notes; ideal for quick math within a note. From dates ('Now + 20 days'), percentages ('10% of 120'), units of measurement ('100cm + 2m'), arithmetic ('10 + 5') and more! (can use for quick calculations when entering trades 📝)
‘Hover Editor’ (NothinglsLost) ⭐
☞ Transform the Page Preview hover popover into a fully working editor. Useful to quickly look into a notes properties metadata on hove; quickly review a trade without opening the note.