Three Black Crows on BTC weekly 🐦⬛
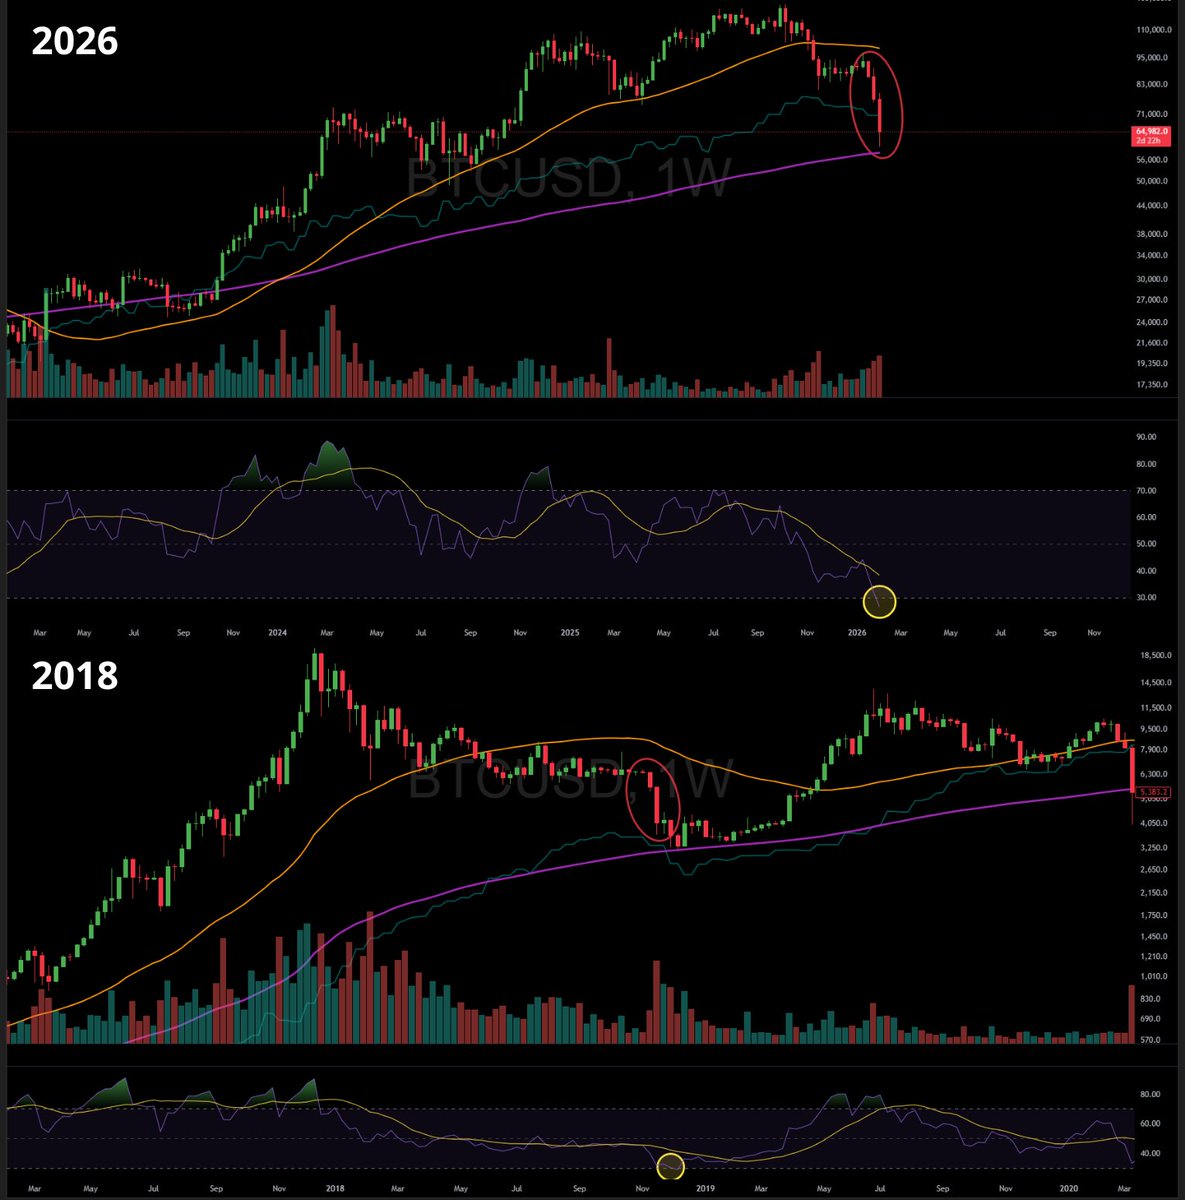
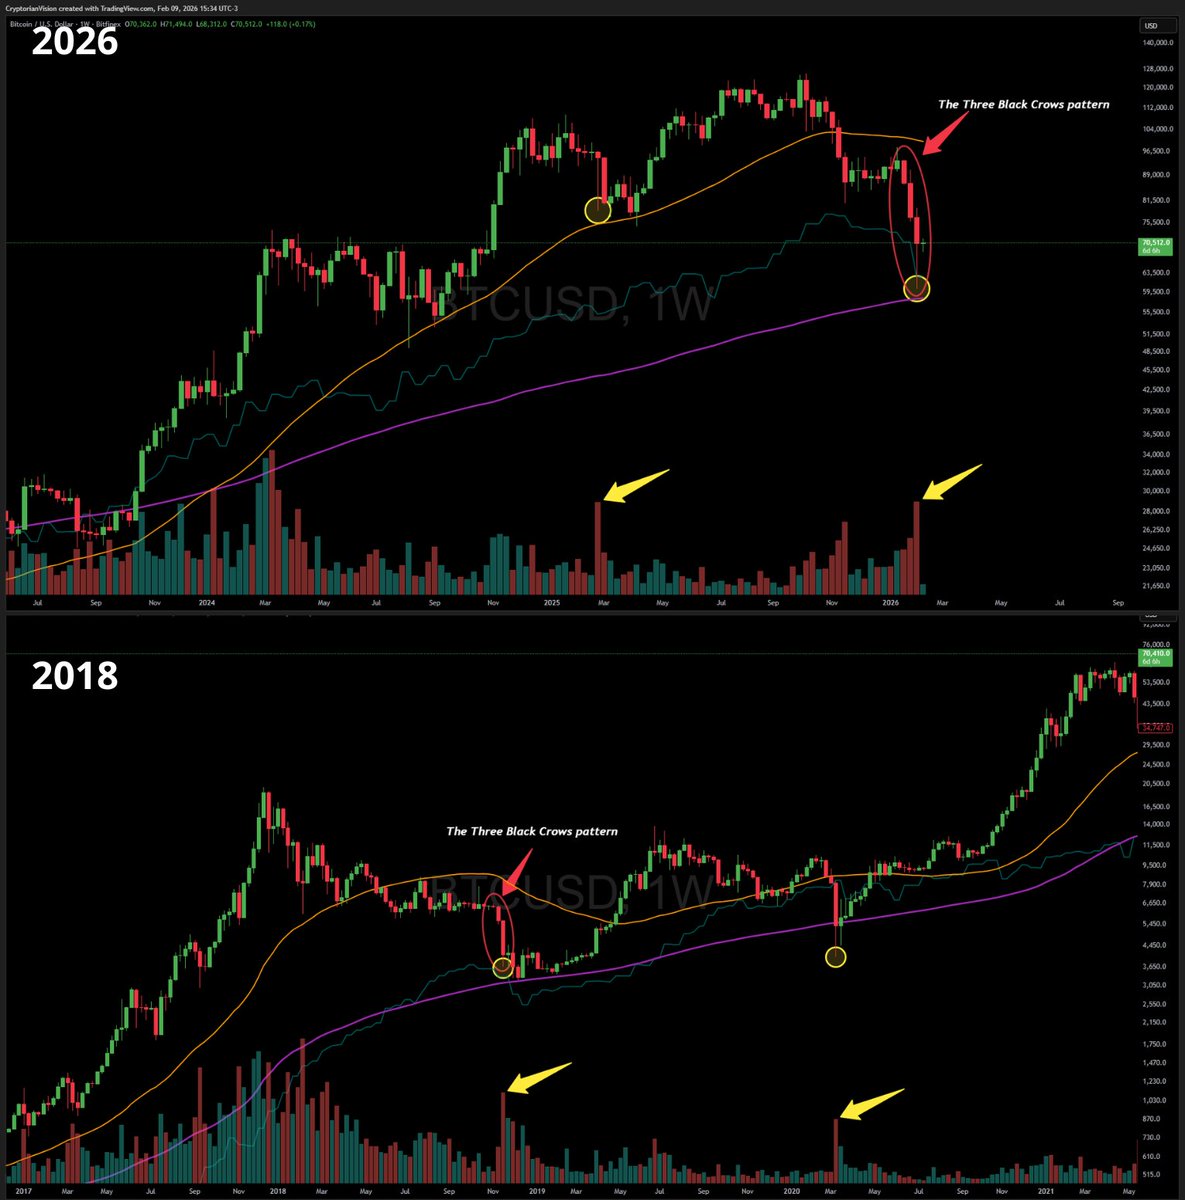
The Three Black Crows pattern just printed on the weekly Bitcoin chart, but context matters.
This setup is usually bearish when it appears at the top.
When it shows up after a prolonged drawdown, near major support, it often signals capitulation rather than continuation.
What this can mean:
Selling pressure is accelerating → panic phase
Last weak hands are being flushed
Market is approaching an exhaustion point
Markets bottom in fear, not in confidence.
Three Black Crows on BTC weekly 🐦⬛
The pattern played out exactly as expected.
We saw clear capitulation, confirmed by:
➝ Price action
➝ Volume climax on both weekly and daily timeframes
➝ On-chain data showing stress and forced selling
➝ Trader liquidations exceeding $8B in just 12 days
With that, the base case is a macro bottom formation, reinforced by:
➝200-week moving average
➝Weekly oversold conditions
Even if BTC ranges sideways and revisits the lows, this remains consistent with a bottoming process.
📌 Open risk:
If BTC closes a weekly candle below $60.1k, price may target:
➝ ~$51k
➝ Extreme case around ~$40k (lower probability, but cannot be ignored)
This scenario gains traction if SPX and NASDAQ correct, as both are stretched, and BTC is currently in a position of relative weakness.
My bias remains:
➝SPX/NASDAQ continue higher
➝Russell 2000 outperforming
➝Overall environment still risk-on
This is the map.
Now its all about execution and risk management.
@maxpain_crypto@CryptoCon_ This cycle didn't have an aggressive rise, so why should it have an aggressive drop of -78%, which is greater than the drop in the previous cycle? https://t.co/12whWLNgN6
No banana zone. No capitulation.
This cycle never entered a true banana zone.
No parabolic expansion → no violent capitulation.
Corrections match the move:
slow expansion = slow, time-based correction.
Thats why $27k–$32k makes little sense.
The real support zone is much higher:
• 200W SMA ~ $60k
• Mining cost ~ $70k
• Prior cycle top (69k → 60k)
• 7-month consolidation (73k–50k)
• 0.618 macro Fib ~ $58k
Base case: bottom forms above $50k via consolidation, not panic.
There is a lower-probability risk of a deeper move toward the 0.78 macro Fib around ~$40k, and Im prepared if price gets there
Markets punish extremes, and this cycle never had one.
(This is my base scenario if BTC actually goes down)
Three Black Crows on BTC weekly 🐦⬛
The Three Black Crows pattern just printed on the weekly Bitcoin chart, but context matters.
This setup is usually bearish when it appears at the top.
When it shows up after a prolonged drawdown, near major support, it often signals capitulation rather than continuation.
What this can mean:
Selling pressure is accelerating → panic phase
Last weak hands are being flushed
Market is approaching an exhaustion point
Markets bottom in fear, not in confidence.
The moment of truth
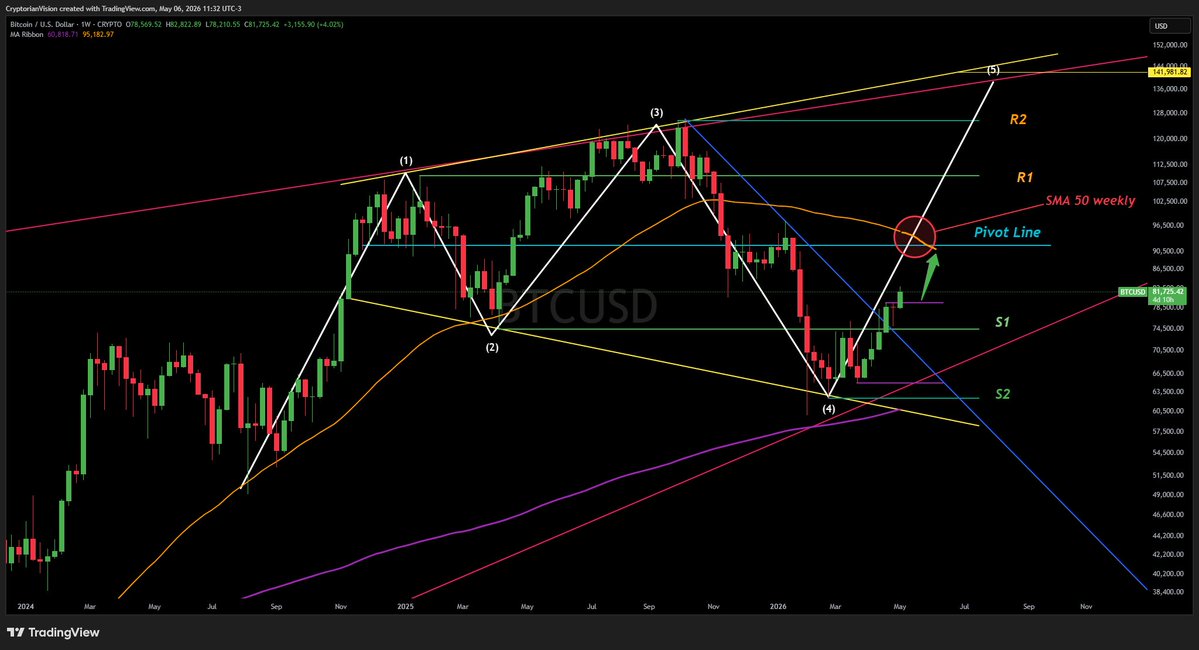
Imo, #BTC is heading towards the Pivot Line zone (~92k), and that will be the moment of truth to see if we'll see further gains or a complete rejection of the SMA 50 weekly
If the Pivot line is broken easily, we'll see BTC around 140k.
Three Black Crows on BTC weekly 🐦⬛
The Three Black Crows pattern just printed on the weekly Bitcoin chart, but context matters.
This setup is usually bearish when it appears at the top.
When it shows up after a prolonged drawdown, near major support, it often signals capitulation rather than continuation.
What this can mean:
Selling pressure is accelerating → panic phase
Last weak hands are being flushed
Market is approaching an exhaustion point
Markets bottom in fear, not in confidence.
Three Black Crows on BTC weekly 🐦⬛
The Three Black Crows pattern just printed on the weekly Bitcoin chart, but context matters.
This setup is usually bearish when it appears at the top.
When it shows up after a prolonged drawdown, near major support, it often signals capitulation rather than continuation.
What this can mean:
Selling pressure is accelerating → panic phase
Last weak hands are being flushed
Market is approaching an exhaustion point
Markets bottom in fear, not in confidence.
The moment of truth
Imo, #BTC is heading towards the Pivot Line zone (~92k), and that will be the moment of truth to see if we'll see further gains or a complete rejection of the SMA 50 weekly
If the Pivot line is broken easily, we'll see BTC around 140k.
I've been posting about solana:dog1viwbb2vWDpER5FrJ4YFG6gq6XuyFohUe9TXN65u every single day for over two years
I haven't sold a single solana:dog1viwbb2vWDpER5FrJ4YFG6gq6XuyFohUe9TXN65u token ever
I am not going anywhere and there are a hundred thousand solana:dog1viwbb2vWDpER5FrJ4YFG6gq6XuyFohUe9TXN65u soldiers just like me
Three Black Crows on BTC weekly 🐦⬛
The Three Black Crows pattern just printed on the weekly Bitcoin chart, but context matters.
This setup is usually bearish when it appears at the top.
When it shows up after a prolonged drawdown, near major support, it often signals capitulation rather than continuation.
What this can mean:
Selling pressure is accelerating → panic phase
Last weak hands are being flushed
Market is approaching an exhaustion point
Markets bottom in fear, not in confidence.
The moment of truth
Imo, #BTC is heading towards the Pivot Line zone (~92k), and that will be the moment of truth to see if we'll see further gains or a complete rejection of the SMA 50 weekly
If the Pivot line is broken easily, we'll see BTC around 140k.
BTC Megaphone Pattern
Not a perma bull. Just reading the chart.
Heres the deal:
Break S1 → momentum to Pivot (92k)
Break 92–100k → 140k
Fail → 50k
140k still in play
Three Black Crows on BTC weekly 🐦⬛
The pattern played out exactly as expected.
We saw clear capitulation, confirmed by:
➝ Price action
➝ Volume climax on both weekly and daily timeframes
➝ On-chain data showing stress and forced selling
➝ Trader liquidations exceeding $8B in just 12 days
With that, the base case is a macro bottom formation, reinforced by:
➝200-week moving average
➝Weekly oversold conditions
Even if BTC ranges sideways and revisits the lows, this remains consistent with a bottoming process.
📌 Open risk:
If BTC closes a weekly candle below $60.1k, price may target:
➝ ~$51k
➝ Extreme case around ~$40k (lower probability, but cannot be ignored)
This scenario gains traction if SPX and NASDAQ correct, as both are stretched, and BTC is currently in a position of relative weakness.
My bias remains:
➝SPX/NASDAQ continue higher
➝Russell 2000 outperforming
➝Overall environment still risk-on
This is the map.
Now its all about execution and risk management.
Three Black Crows on BTC weekly 🐦⬛
The Three Black Crows pattern just printed on the weekly Bitcoin chart, but context matters.
This setup is usually bearish when it appears at the top.
When it shows up after a prolonged drawdown, near major support, it often signals capitulation rather than continuation.
What this can mean:
Selling pressure is accelerating → panic phase
Last weak hands are being flushed
Market is approaching an exhaustion point
Markets bottom in fear, not in confidence.
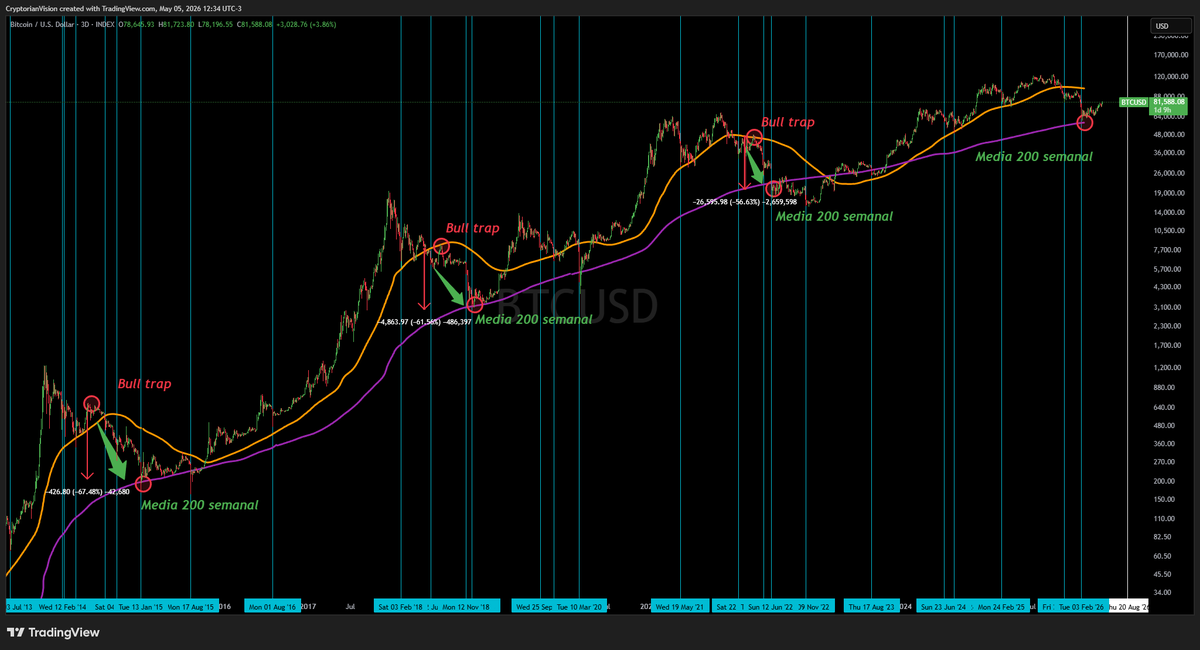
@PravattaMarcelo Única coisa que você esqueceu de comentar, é que em todas as vezes, a media 200 semanal estava a aproximadamente -60% de distancia abaixo do preço do BTC.
Dessa vez o btc ja chegou na sua media 200 semanal e sobrevenda semanal.
Ja esta diferente.
I'm not seeing things.
What we see in this post and its comments is a general consensus of decline.
Nobody is angry that he says Btc will fall further; everyone agrees.
What happens to the market when everyone expects more falls?
@coinbureau It's as if TradFi didn't have any gamblers.
All markets are driven by leveraged gamblers; everyone sees the markets as leveraged bets to change their lives overnight.