Over the last decade, small cap funds and gold ETFs have shown similar performance as of last Friday. However, the last 18 months tell a different story: Gold has delivered an impressive absolute return of 52%, while small cap funds have seen an average decline of 4%.
Despite the negative sentiment surrounding small caps due to this recent underperformance, they have still provided meaningful returns over the long term. It's important to view volatility in equity as a potential ally in wealth creation. Embracing the ups and downs can lead to significant opportunities, while viewing it as a threat may hinder wealth-building potential.
Always do your due diligence before investing.
Disclaimer: Please keep in mind that mutual fund investments are exposed to market risk. Before making any investment decisions, review all scheme-related documentation thoroughly. The material of the reports is intended solely for informational purposes and should be used by the recipient. While we made significant efforts to compile the data and contents of this report, we give no promises about the logic of the assumptions or the veracity of any data. Any decisions made using this material are completely the responsibility of the recipient. We reserve the right to correct any errors or discrepancies in the reports that are discovered or brought to our attention at any time. Perform your research thoroughly before making any investments. Why? Just because it's interesting.
Anniversaries shouldn’t be just about looking back and how far we’ve come, or how much things have changed.
In late 2025, when we celebrated 15 years of @ET_Wealth, we thought about looking ahead 15 years. How would life in 2040 be? We asked financial planners what the ONE UNEXPECTED EXPENSE we need to prepare for is. The one expense that would be non-negotiable then. From assisted living to climate-controlled living, the answers will surprise you.
@nehal_mota@KirtanShahCFP@adityadhagecfp@AgarwalAditya@AmolPlanRupee@sajithpai@DeepakAxiom@deepeshraghaw@VivekBanka7
Stop Comparing Mutual Funds with Stocks or Gold
Mutual Funds are often misunderstood—and wrongly compared with direct equities, bonds, or commodities.
📌 Key clarification:
Mutual Funds are not an asset class. They are an investment vehicle designed to manage asset classes professionally.
Why Mutual Funds matter:
• Institutional diversification
• Risk reduction through process
• Professional fund management
• Behavioural discipline for investors
📊 Research shows that only a small % of stocks create long-term wealth. Mutual Funds capture these winners without requiring prediction.
✅ Mutual Funds should be compared only with:
1️⃣ Their benchmark indices
2️⃣ Peer funds within the same category
3️⃣ Risk-adjusted, rolling return metrics
Follow for daily research-backed insights 👇
🔗 Telegram: https://t.co/vTlAXA6X9N
Disclaimer: For educational purposes only. Mutual fund investments are subject to market risks.
#InvestorAwareness #MutualFundEducation #RiskVsReturn #WealthManagement
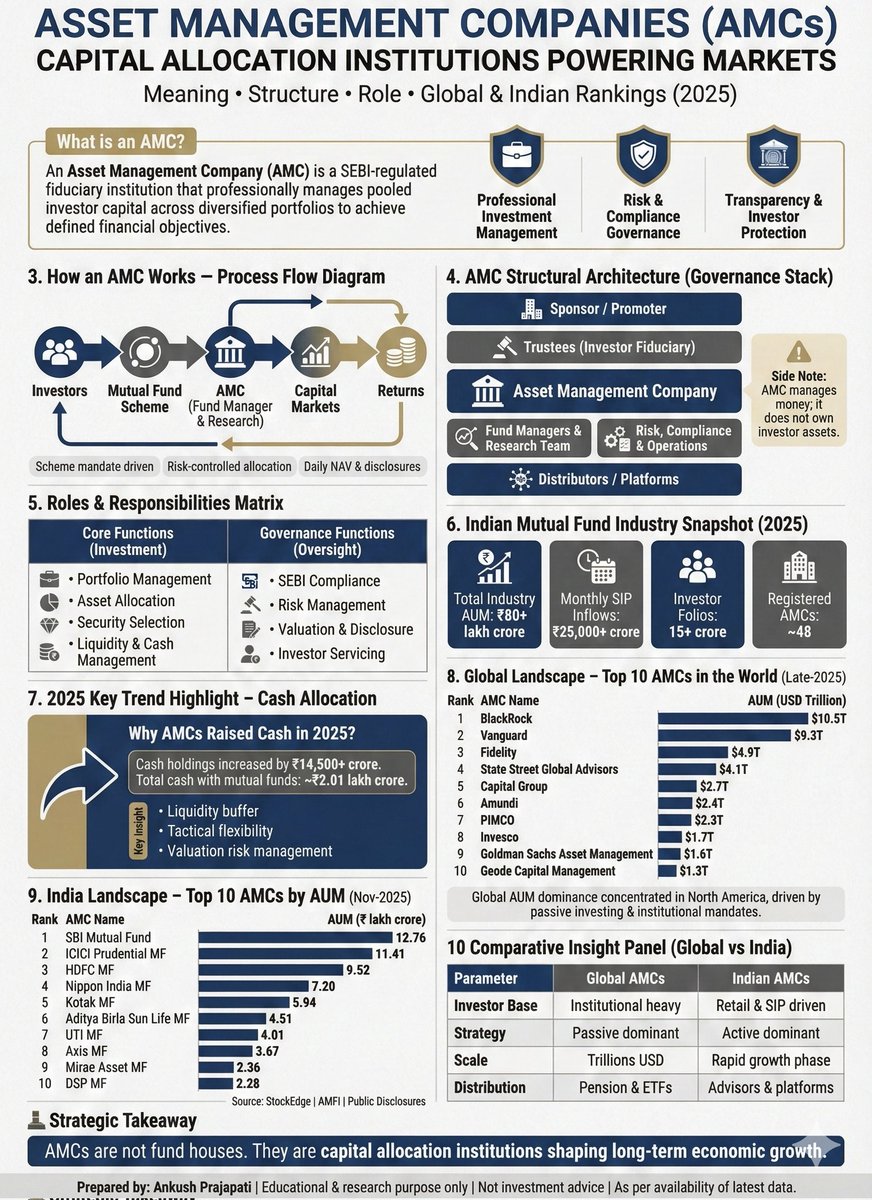
(Day 2) Term : AMC Explained
1️⃣ What is an AMC?
An AMC professionally manages investor money under SEBI regulation with fiduciary responsibility.
2️⃣ How AMCs Work
Your money is invested based on predefined schemes, not ad-hoc decisions.
3️⃣ AMC Structure
Sponsor → Trustees → AMC → Fund Managers → Risk & Compliance.
Money belongs to investors—not the AMC.
4️⃣ Roles of an AMC
✔ Portfolio management
✔ Risk control
✔ Liquidity planning
✔ Regulatory compliance
✔ Investor servicing
5️⃣ India MF Industry (2025)
• ₹80+ lakh crore AUM
• ₹25,000+ crore monthly SIPs
• 15+ crore investor folios
6️⃣ Why cash holdings rose in 2025?
₹14,500+ crore increase reflects prudence, not fear.
7️⃣ Global vs India AMCs
Global: Passive & institutional
India: Active & retail-driven
🔑 Key Takeaway
AMCs are the engine room of mutual funds.
Follow for daily finance clarity 👇
🔗 https://t.co/vTlAXA6X9N
Educational content only. No investment recommendation.
#MutualFunds #AMC #InvestorAwareness #WealthCreation
𝐄𝐯𝐞𝐫 𝐰𝐨𝐧𝐝𝐞𝐫𝐞𝐝 𝐰𝐡𝐲 𝐲𝐨𝐮𝐫 𝐒𝐈𝐏 𝐫𝐞𝐭𝐮𝐫𝐧𝐬 𝐝𝐢𝐬𝐚𝐩𝐩𝐨𝐢𝐧𝐭𝐞𝐝 𝐢𝐧 𝟐𝟎𝟐𝟓? 𝟐𝟎𝟐𝟔 𝐆𝐚𝐦𝐞 𝐏𝐥𝐚𝐧?🤔
Here’s the 𝐬𝐡𝐨𝐜𝐤𝐢𝐧𝐠 𝐭𝐫𝐮𝐭𝐡 behind equity mutual fund performance:
Large Cap crushed it at 9.24% (vs 15.15% in 2024) 🥇
But Small Cap? Disaster at -4.47% 😱 (vs 26.85% last year)
Top performers that saved the day:
•ICICI Pru Large & MidCap: 14.39% 👑
•ICICI Pru Large Cap: 11.32%
•HDFC Flexi Cap: 11.43%
Reality check for SIP investors:
Large caps = Your safe bet in choppy markets
Small caps = High risk, high drama
Diversify across Large + Large&Mid (7-9% category avg)
Skip small cap FOMO for now
What category allocation are you rethinking? 👇
#MutualFunds #SIP
India VIX Explained | Risk, Volatility & Portfolio Strategy
India VIX is currently trading near 9.68 (30-12-2025) — indicating a low-volatility market regime.
But history shows:
• Low VIX often precedes volatility expansion
• VIX moves inversely to NIFTY
• Volatility impacts mutual fund behaviour across categories
• Arbitrage funds benefit during high VIX phases
• SIP discipline matters most when VIX is elevated
Key insight:
India VIX is a risk thermometer, not a return predictor.
Understanding volatility cycles helps investors stay rational, not reactive.
Telegram: https://t.co/vTlAXA6X9N
Disclaimer: For educational purposes only. Market risks apply.
#IndiaVIX #Volatility #IndianMarkets #MutualFundInvesting #RiskAwareness
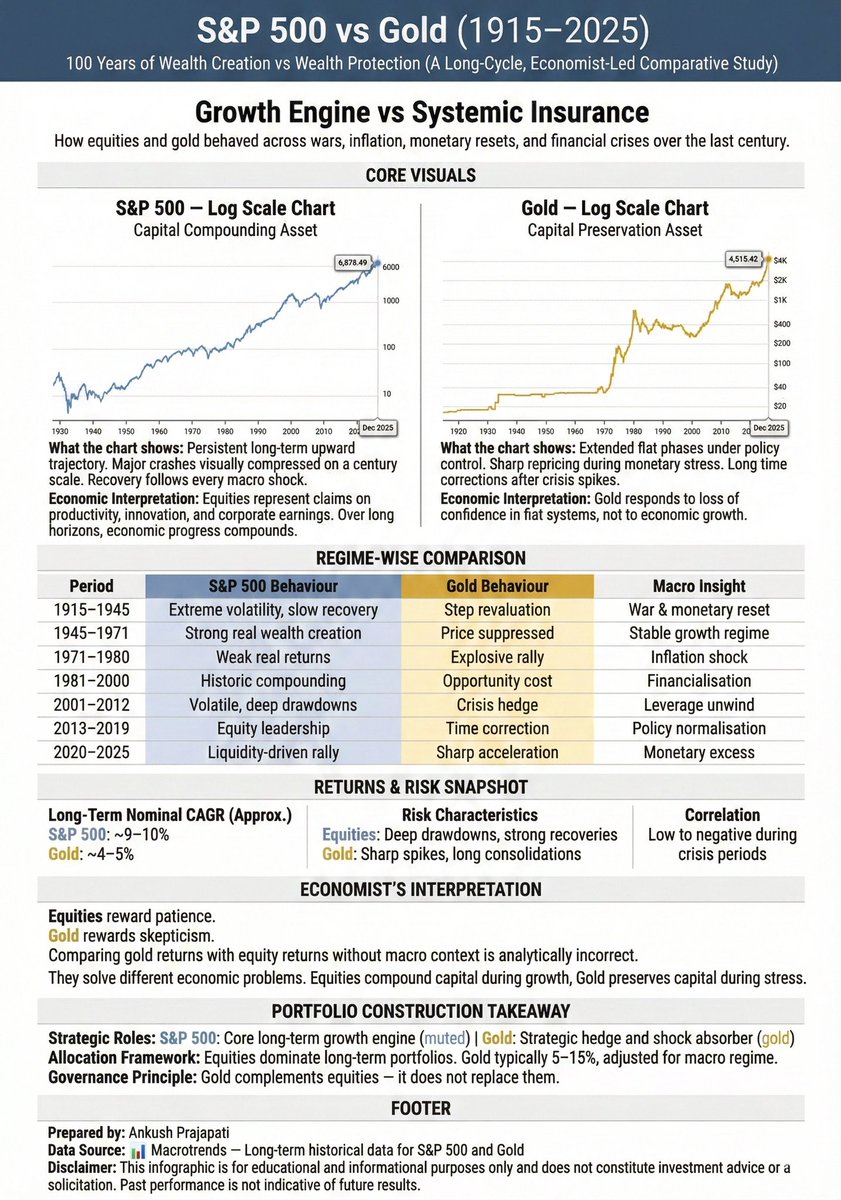
S&P 500 vs Gold: 100 Years of Growth vs Protection
A century of data (1915–2025) makes one distinction clear:
• Equities compound wealth through productivity and earnings
• Gold preserves purchasing power during monetary stress
The S&P 500 reflects confidence in economic progress.
Gold reflects skepticism toward monetary systems.
Comparing their returns without macro context is a category error.
They solve different economic problems—and belong together in long-term portfolios.
📊 Source: Macrotrends
🔗 Follow for research-driven insights:
Telegram: https://t.co/vTlAXA6X9N
Disclaimer:
This content is for educational and informational purposes only and does not constitute investment advice. Past performance is not indicative of future results.
#AssetAllocation #LongTermInvesting #PortfolioConstruction #Gold #Equities #MacroEconomics #WealthManagement
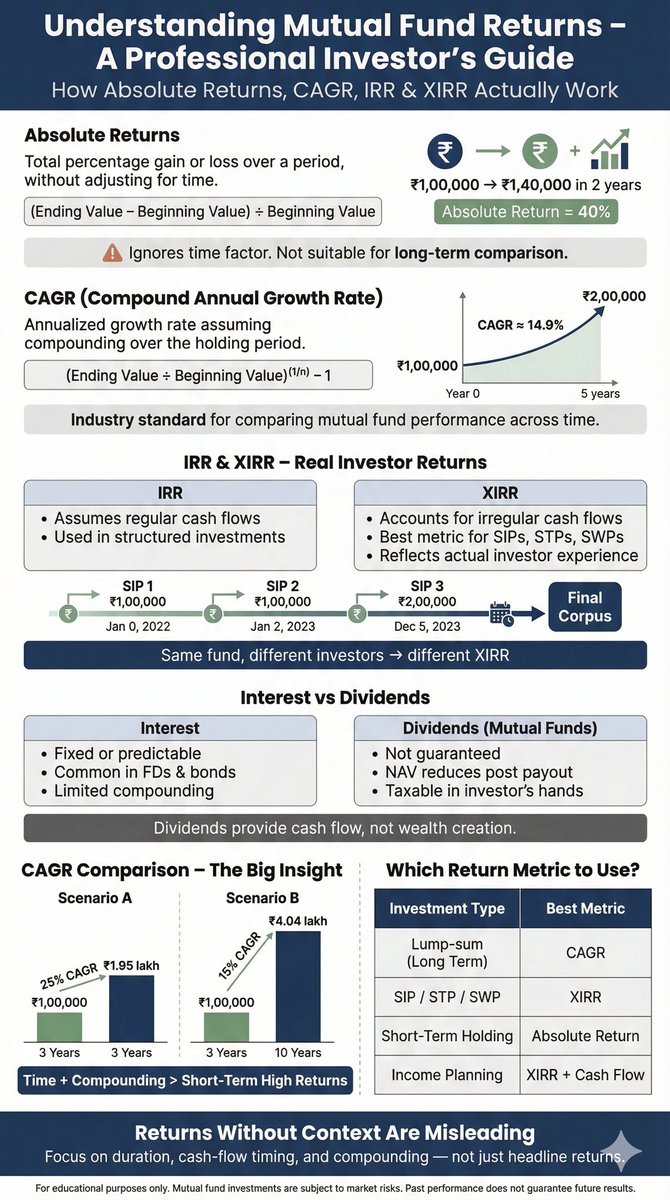
Understanding Mutual Fund Returns – Explained Clearly
Most investors focus on returns, but few understand how those returns are calculated.
This infographic explains:
• Absolute Returns vs CAGR
• IRR vs XIRR (why SIP returns differ for every investor)
• Interest vs Dividends
• Why long-term compounding beats short-term high returns
Follow for daily research-based insights:
👉 https://t.co/vTlAXA6X9N
Disclaimer:
This content is shared for educational purposes only. It is not investment advice or a recommendation to buy or sell any security. Mutual fund investments are subject to market risks. Past performance does not guarantee future results.
#MutualFundReturns #XIRR #CAGR #LongTermInvesting #FinancialLiteracy #InvestorEducation
This study tracks annual quartile rankings over the last 10 years across equity and hybrid categories, considering only schemes with a full decade of performance history.
Key analytical takeaway:
Sustainable wealth creation is less about occasional Top Quartile years and more about repeatability across market cycles.
🔍 What this framework highlights:
Funds repeatedly appearing in Top + Upper Mid quartiles demonstrate process strength, not luck
Long-term consistency filters out narrative-driven short-term outperformers
Category-relative performance across bull, bear, and sideways markets offers truer risk-adjusted insights
📌 Investment insight:
Chasing last year’s top performer is tactical.
Allocating to funds with persistent quartile discipline is strategic.
Data as on 18-Dec-2025 | Analysis based on rolling annual quartile positioning
Find the full PDF on Telegram: https://t.co/vTlAXA6X9N
Disclaimer: For educational purposes only. Past performance and quartile rankings do not guarantee future outcomes. Not investment advice.
#MutualFunds #FundConsistency #QuartileAnalysis #LongTermInvesting #WealthManagement
Understanding Mutual Fund Ratios with a Driving Analogy
To simplify fund analysis, here’s how each ratio behaves when mapped to a car:
• TER = Fuel/Toll cost
• Sharpe = Mileage per litre
• Alpha = Driver’s skill vs benchmark
• Beta = Shock absorber (volatility)
• SD = Road bumpiness (return swings)
• R² = Copycat score (index tracking)
• Sortino = Smoothness during bad roads (downside risk)
• Information Ratio = GPS accuracy
• Capture Ratios = Performance in traffic (up/down markets)
A practical, intuitive framework to evaluate behaviour—not just returns.
Telegram: https://t.co/vTlAXA6pkf
Disclaimer: For education only. Not investment advice.
#MutualFunds #RiskMetrics #Investing #PersonalFinance #MFResearch
#Nifty is inching higher exactly as expected, prices reversed from mid bands & made a high of 25080 to 1st target of 25100 discussed when prices were near 24600 levels. If you following my tweets you are witnessing real time application of actual price action, aiming 25190 now
#Nifty morning tweet mentioned that 15 mins above 24690 will take prices to 24780 as time is on buy side, BANG ON! Nifty already made a high of 24900, above 24920 up move resumes to 25100 turning daily bias positive - You witnessed power of Time trading if followed Nifty tweets!
Building your first ₹1 crore takes more time than the next ₹9 crore combined.
Sounds wild — but it’s true.
The journey from ₹1 crore to ₹10 crore doesn’t get harder. It gets faster.
Here’s the math and mindset shift that explains why 🧵