‼️New package updates, blog post, and data visualization! Learn about subdivision surfaces and displacement mapping and how they can be used to visualize data on curved surfaces using the rayverse and R.
Blog:
https://t.co/mDRFR4v5YI
#RStats#rayvertex#rayrender#dataviz
‼️New year, new R package, new Quarto website, new blog post! Introducing the {raybevel} package: generate 3D buildings, 3D beveled polygons, 2D inset polygons, and straight skeletons entirely in R!
Blog post:
https://t.co/jQnuE1m8WX
HAPPY NEW YEAR! #RStats#rayshader#raybevel
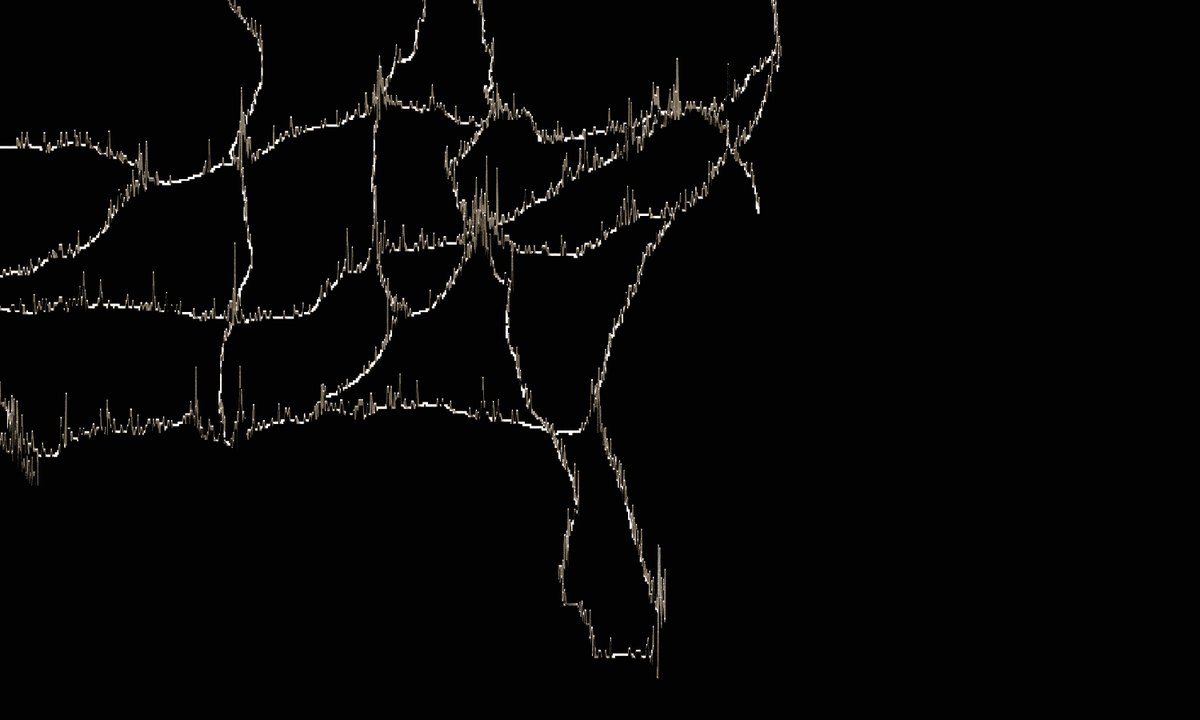
2021 traffic fatalities along the major US interstates using DoT data
An attempt to recrate some of the vintage 3d charts @tylermorganwall unearthed a while back
#rayshader#rstats
`render_buildings()` is shaping up to be the coolest new rayshader feature in a long time! It only took a year finding a moment of free time here and there in the evenings to create/develop/debug the...
#RStats#rayshader#raybevel#rayverse#dataviz
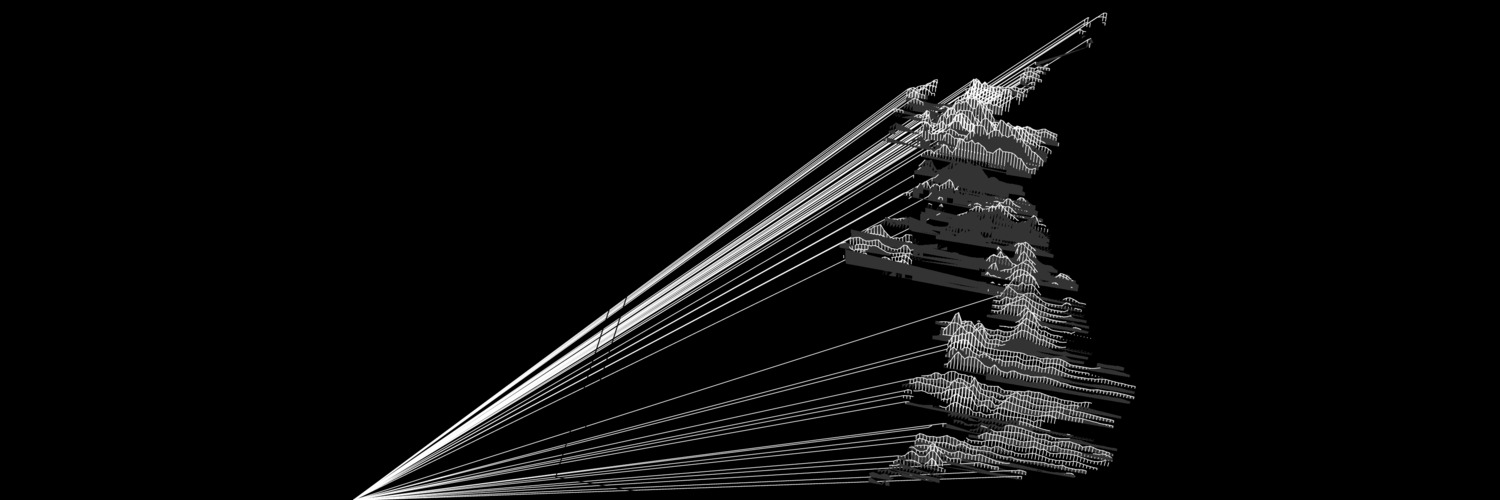
I always wondered what a population density spike map + political map would look like so I had a go at it (in new version of #aerialod) and my verdict is: slightly mad, but quite interesting