Do you get feature requests all the time?
In my latest post I describe how to hack conversations from feature requests into Outcome-based direction by using Reversed Impact Maps
https://t.co/XZv94uTB7F
Despite best efforts, many struggle with effective #Communication across a business. Is visual mapping the answer? @csteinlehner and @adamjwakeling discuss in the latest episode. Full link in comments below.
Thank you @swardley for facilitating this. I wasn’t expecting these results while we were in the process. Very interesting new perspectives to explore further.
Exploring the future of work, a group of 40+ mappers, 10 hours, many maps and perspectives created. End result, where to invest depends upon your purpose - benefiting society or making money.
Excellent post on capturing better insights from customer calls. Implemented (a version of) this myself. Visuals help a lot: https://t.co/WqWMqvDeTN via @csteinlehner
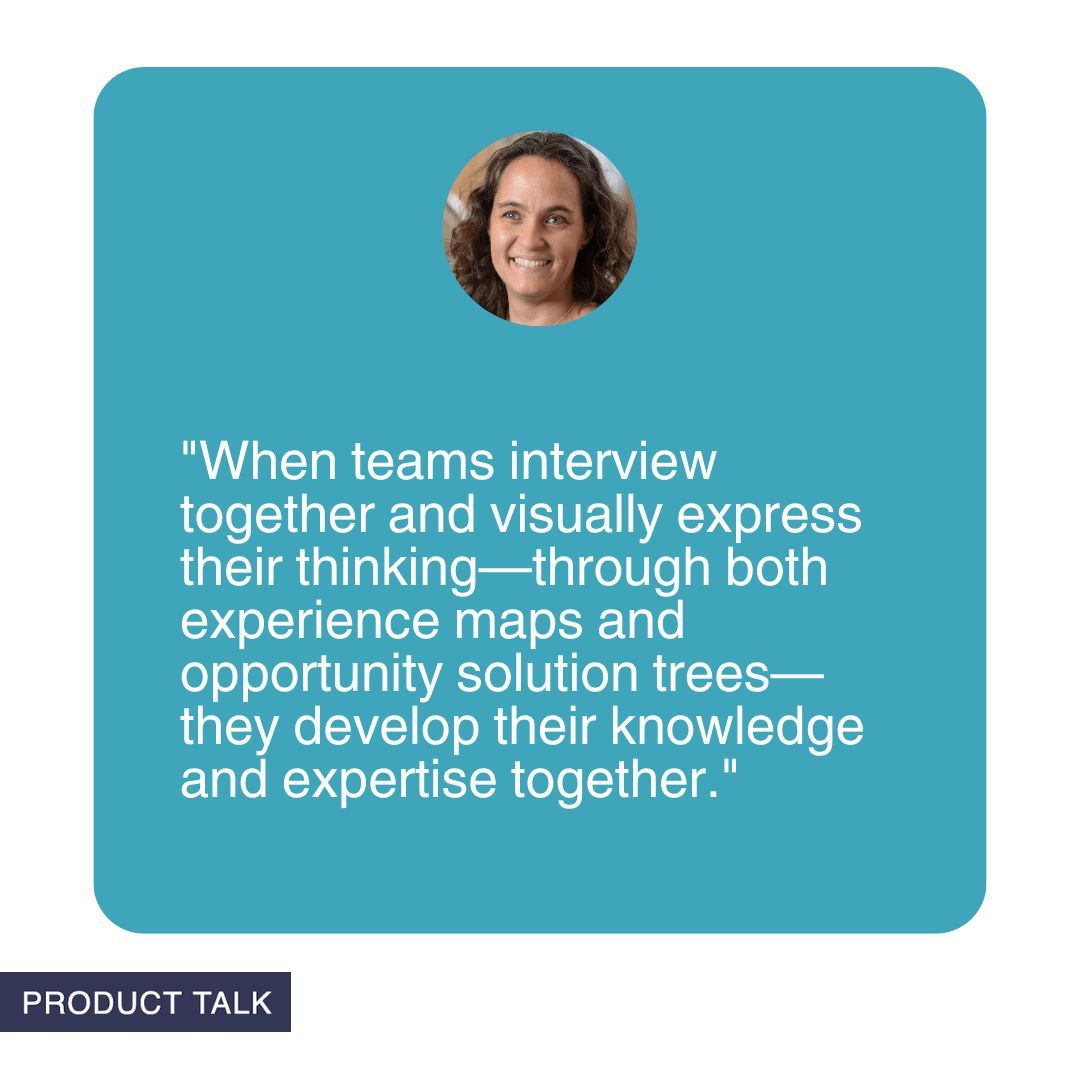
"When teams interview together and visually express their thinking—through both experience maps and opportunity solution trees—they develop their knowledge and expertise together."
https://t.co/tHMTI62P9e
#prodmgmt#ux#engineering
We didn’t get trapped in an endless stream of personal insights and opinions. But were able to connect our personal and collected knowledge to the big picture and the small details.
For me, the biggest difference from other formats is the focus on the shared picture. Yes, we talked a lot during these sessions, but we had a representation of our discussions which we further challenged and developed together.
Fundamentally, what I'm doing in the process is taking people out of a world of stories, of text (including syntax, rules and styles) and into a world of things, relationships and context. Most people who've been through this exercise seem to find it positive.
Introducing – Paragraphica! 📡📷
A camera that takes photos using location data. It describes the place you are at and then converts it into an AI-generated "photo".
See more here: https://t.co/Oh2BZuhRcf
or try to take your own photo here: https://t.co/w9UFjckiF2
Christopher Nolan doesn’t use detailed outlines.
Instead, he “draws shapes and diagrams and other structural things.”
Like this — the plot map Nolan used for Inception.
Here’s a breakdown:
♟️ Interested in strategy?
📍🗺️ Want to learn how to Wardley Map?
👉 In part one of our series, you’ll learn foundational principles & begin to map the basics—from the creator himself, @swardley.
🍿 Watch now! https://t.co/5IxI61tZ2R
@johncutlefish It mostly depends on what kind of meeting we are talking about. A bunch of people talking about ‘what needs to be done’, leaving with different impressions vs. collaborating group of people creating a shared artifact to act on and communicate with further.
Liebe Absolvent:innen des Studiengangs Interfacedesign der @FHPotsdam: Wir feiern im Juni unser zwanzigjähriges Bestehen und veranstalten ein großes Alumni-Event! Wenn ihr die Einladung nicht bekommen habt, schickt mir eine E-Mail oder DM! Gern re-tweeten!