Due to my immense quarantine-induced boredom, I have started tracking and visualizing the spread of the COVID-19 on my own for fun. I have been working on this for some time now, and will start posting my findings on here to help people understand what is going on...
Oh goodness!!
Hi 👋🏼🤠
I’ve been looking forward to this day for a long time and am immensely grateful to be healthy and happy and surrounded by amazing people. I feel recharged and more ready than ever to launch a new vision of PL music and live events.
👀 Sneak a peek at the deepest & sharpest infrared image of the early universe ever taken — all in a day’s work for the Webb telescope. (Literally, capturing it took less than a day!) This is Webb’s first image released as we begin to #UnfoldTheUniverse: https://t.co/tlougFWg8B
This is one of those rare moments that humanity is making a great leap forward. This video shows two passengers riding in a @VirginHyperloop pod for the first time – making transportation history: https://t.co/4PRA6PN8B1
After being let go by the university of Texas and doing some commentating for a few years, @CoachMackBrown Brown has the UNC Tar Heels undefeated and ranked #5 in the country. A great man, coach, and human being whom I’m lucky to call a friend. Good luck against Fl St Saturday 😊
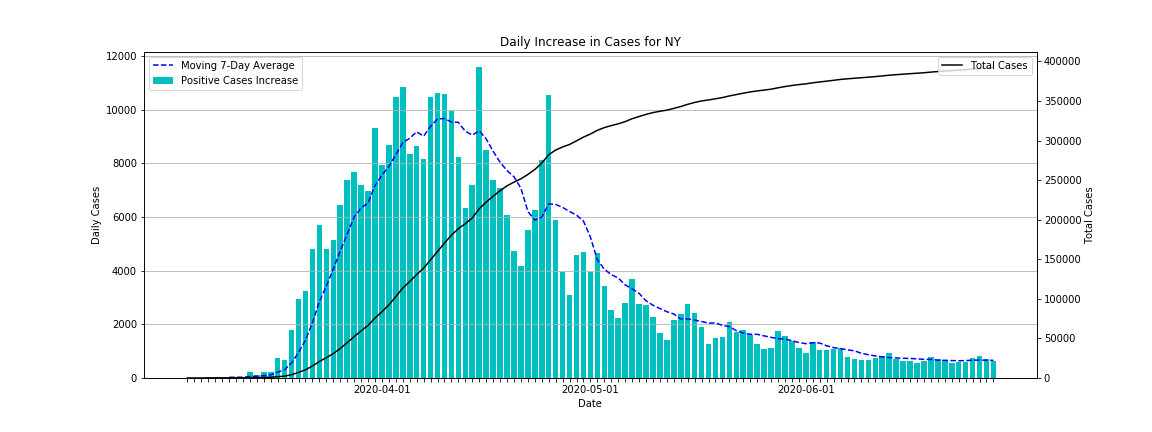
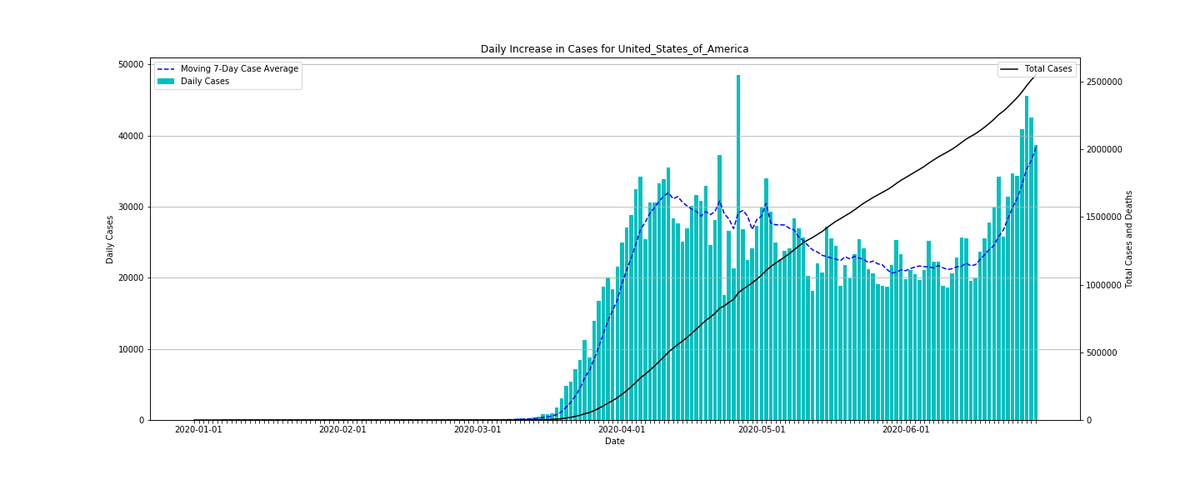
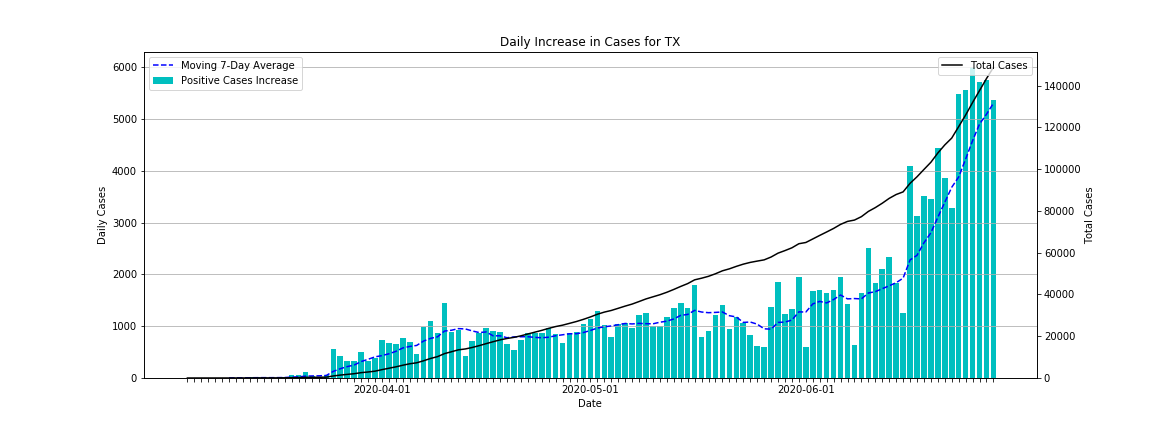
Looking at NY's graph, we can see that they peaked back in March/April and have since significantly slowed down there growth rate. Compared to TX where the growth rate took off over the last few weeks.
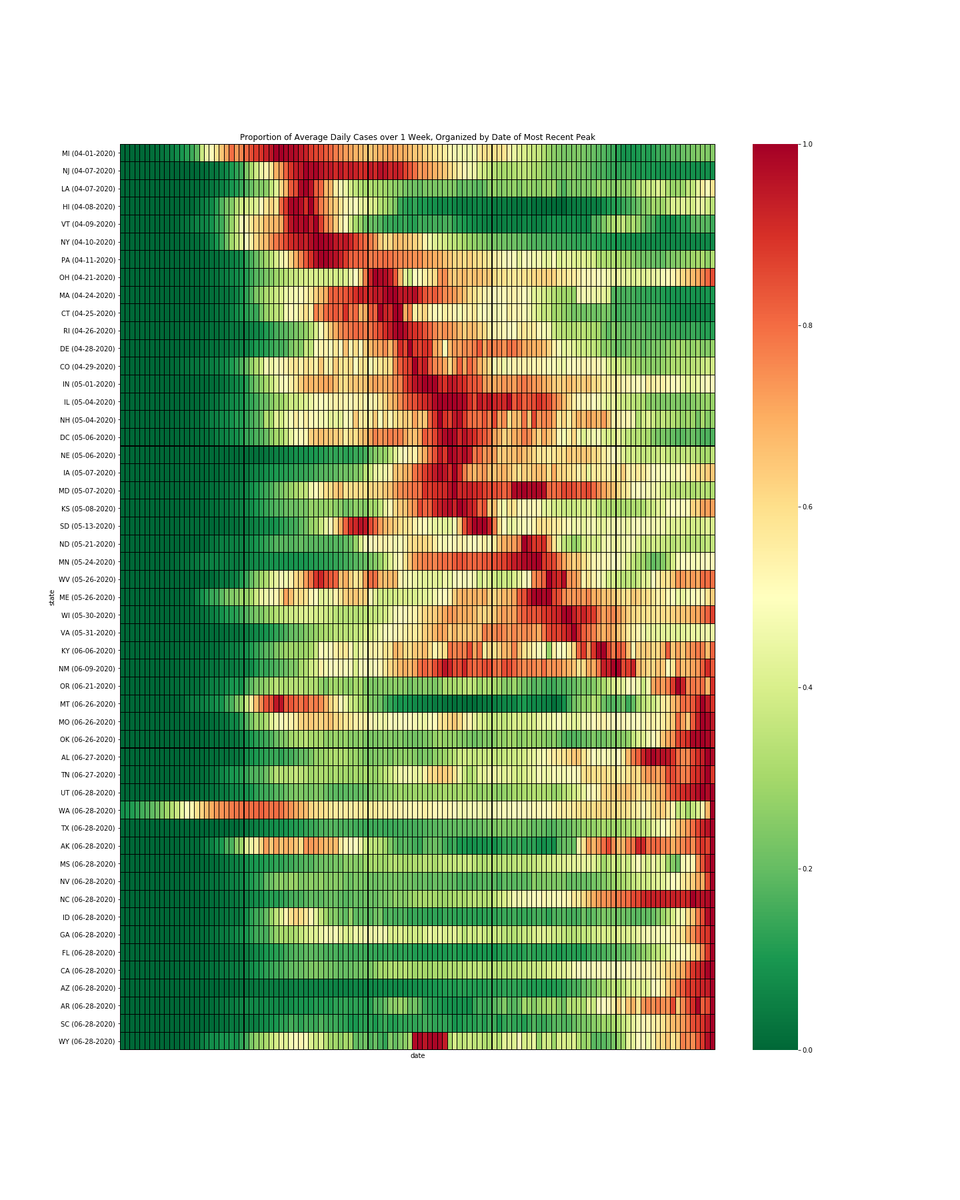
Visualizing "second peak" of new cases in US. The heatmap shows each state's growth rate as a proportion of the highest growth rate, for each state, ordered by date of most recent peak (darkest red = highest growth rate for that state)... 15 states peaking today #covid#covid19
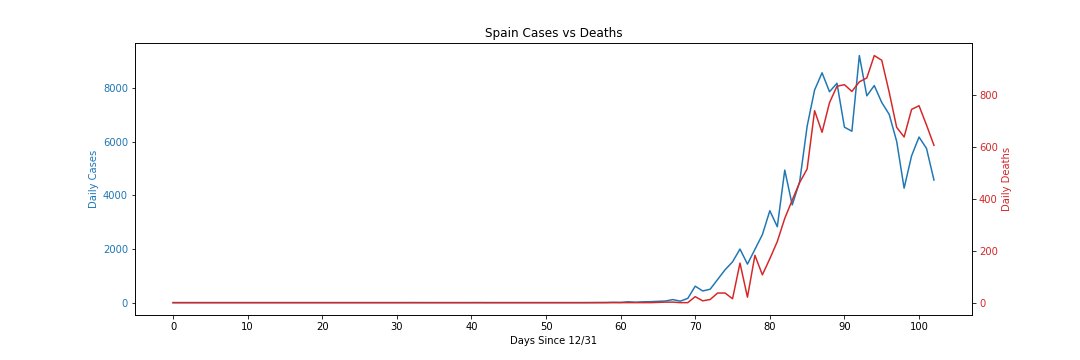
However, globally the curve is starting to flatten. European countries are starting to see the number of daily cases and deaths drop. Hospitalization rates in NY have also dropped, the first signs that the infection is slowing down. Social distancing is working.
Due to my immense quarantine-induced boredom, I have started tracking and visualizing the spread of the COVID-19 on my own for fun. I have been working on this for some time now, and will start posting my findings on here to help people understand what is going on...
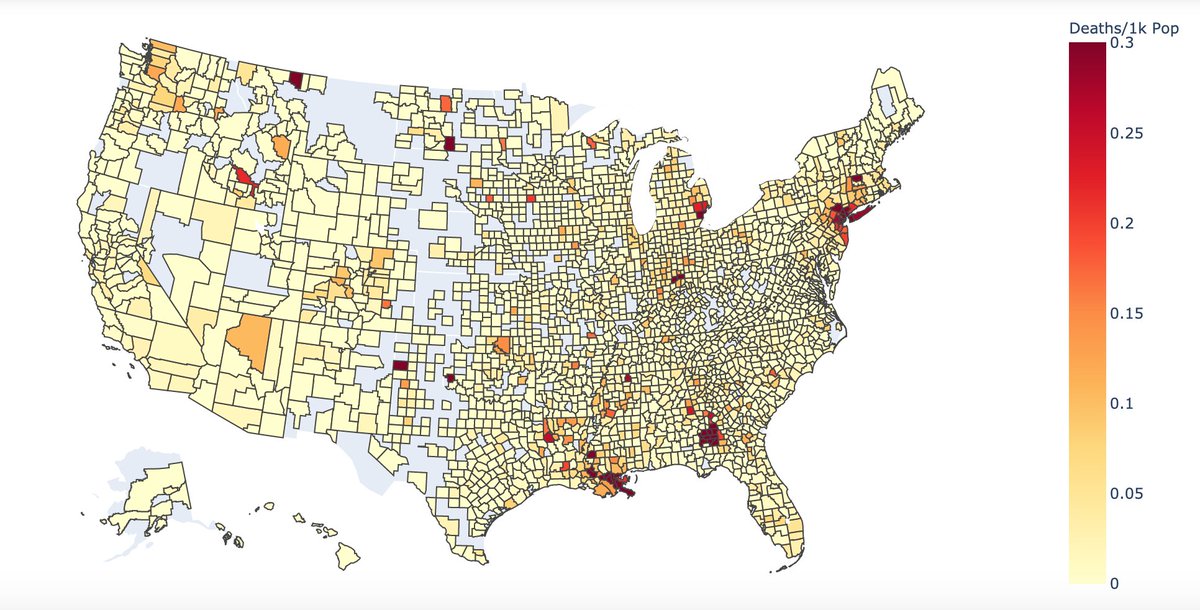
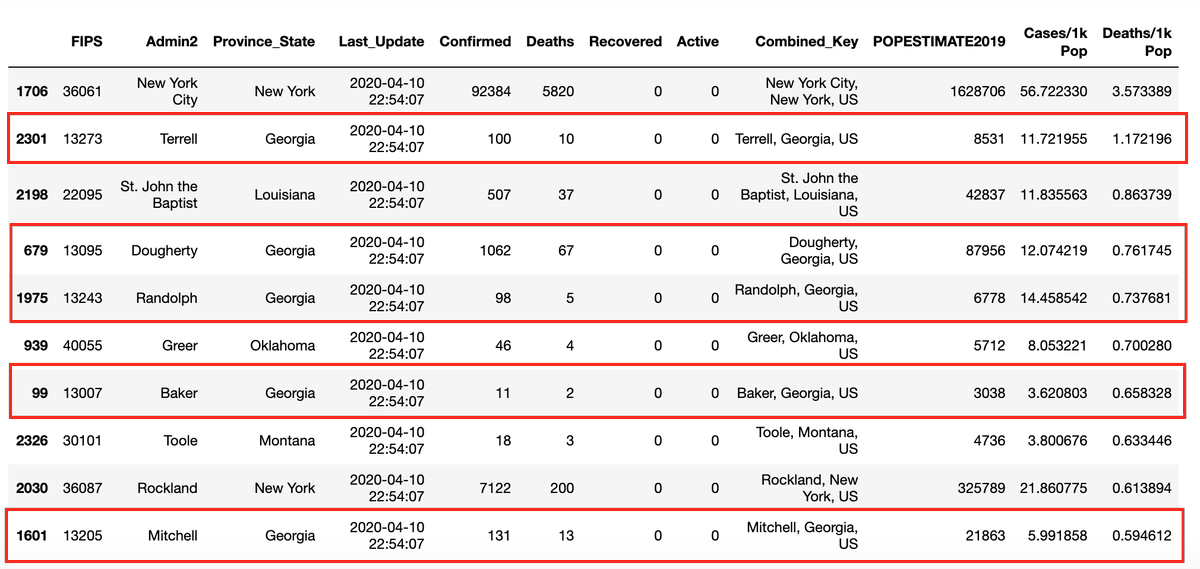
Georgia contains 5 of the top 10 deadliest counties for COVID19. These small counties have some of the highest per capita death rates among all US counties after someone carrying the virus attended a funeral gathering of 200+ people https://t.co/AgGmVI5hYW #update#coronavirus
3. Here we are seeing infection rates among the Top 10 countries over the past 2 weeks. While the US has the highest number of cases (124k+), in terms of cases/population, Italy, Spain and Switzerland have much higher infection rates (nearly 4x) than the US.