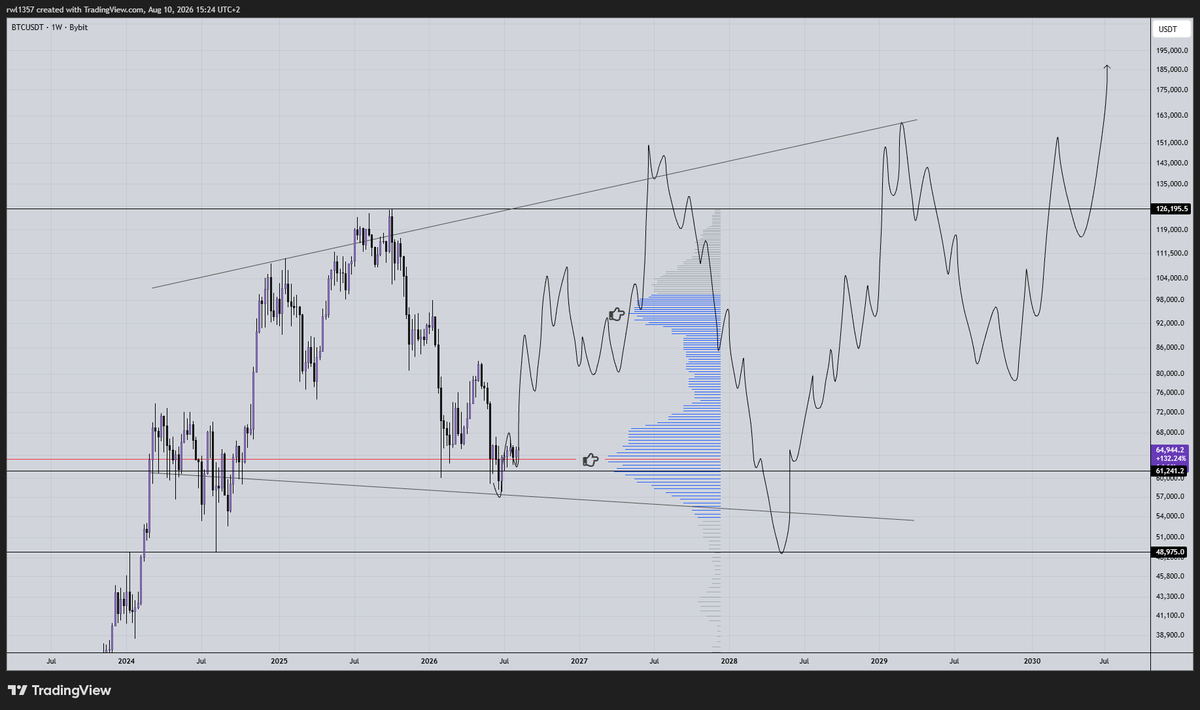
The importance of Bitcoin current level is shown in the volume itself. Basically if we close below 61,200 we will flip a multi-year support level into resistance, which is what we don’t want to see. However, I don’t think we will since the volume is supporting a accumulation phase in this area that has been developing since earlier in the year. Leading to a quick move back toward the 90K–100K range in a very short period of time as there is thin volume in between that will be liquidated quickly. And once there we can begin a small re-accumulation phase before making a shallow ATH, only to send the price back lower, completing a multi-year re-accumulation phase at higher prices while allowing Bitcoin dominance to fall back below 40%.
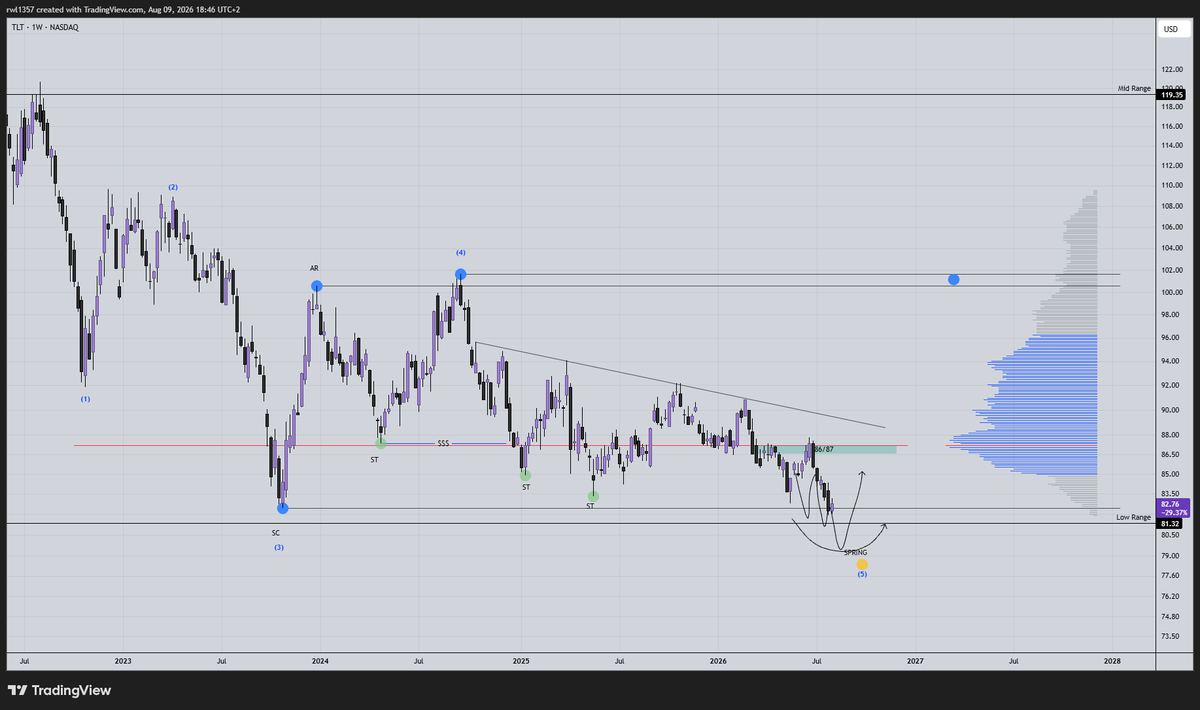
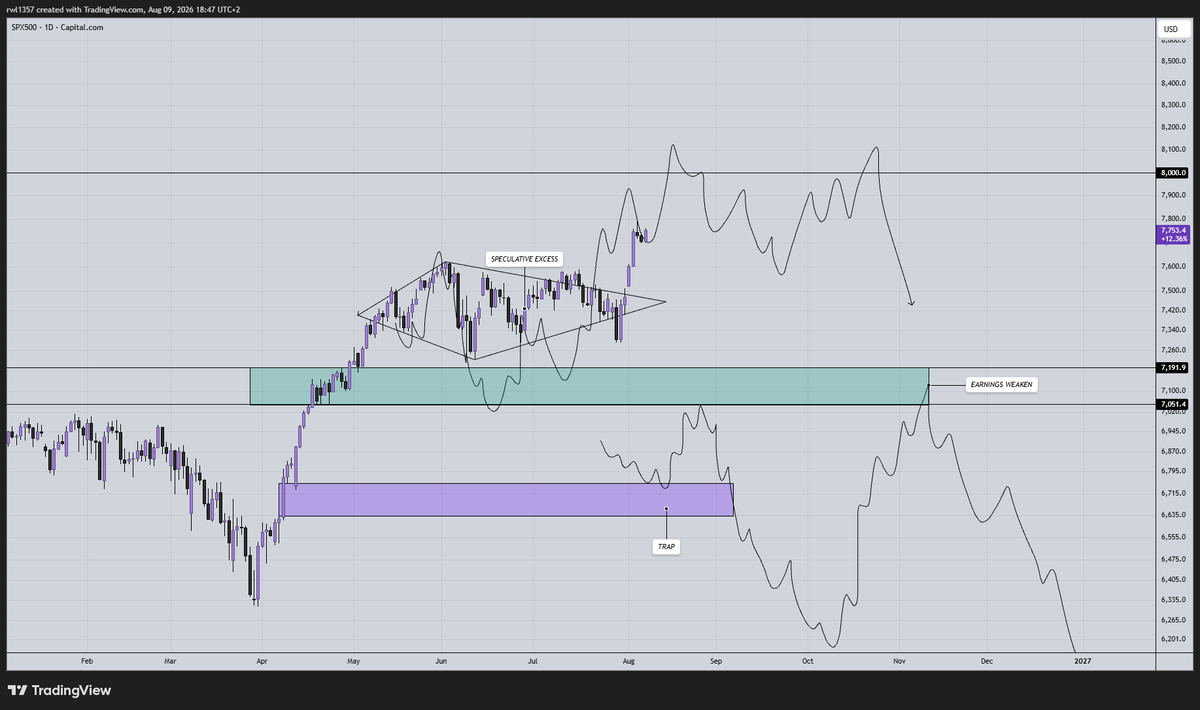
TLT is at new lows while the stock market is at new highs. This is one of the best signs that liquidity is still focused on the risk on environment, but selectively toward the leaders and a few new innovative tech assets.
We are not yet in the late-cycle environment where liquidity shifts toward all asset classes not only blue chips but we will be soon. What I mean by that is, looking at the stock market, I see two ways this could play out compared to previous cycles, especially when comparing it to crypto.
Option one would be a classic top in the stock market, from which money would start flowing into mid-cap and low-cap assets as the stock market begins its distribution phase around 8,000.
Option two would be a classic blow off top, pushing through 8,000 and getting closer to 9,000 in a short period of time. In this scenario, basically everything pumps, especially mid- and low-cap assets, while blue chips remain relatively neutral. The reason would be that sidelined money would want to keep everything elevated while providing liquidity to new assets.
Then for the rest of 2027 until Q3, we could move range bound in a range, allowing emerging and undervalued companies to catch up, especially in the AI sector.
Basically, the whole point is that the cycle can continue even through a late cycle environment for another 8–12 months or so, until the cycle reset happens after Q3 2027 driven by a new round of QE from the Fed, and for the rates well they are becoming irelevant by the day, the more hikes we get or pauses we get the higher leading assets moves up, and the faster cuts happens the faster the cycle ends. Rates are base time catalysts not structure nor price.
Last cycle was the first $BTC bull run with:
-No extended impulse / expansion / parabola / euphoria
-No Altcoin season or BTC.D collapse
-During a Gold bull run and with RTY vs Gold falling
and many more firsts.
When people complain about what a dismal bull run it was, in my eyes, I wonder how it even managed to hold up and even reach 120k under such a different macro backdrop considering RTY vs GOLD has been in a bear market since 2022. Do you not suspect that this makes BTC look even more stronger?
Historically, BTC impulses start after the first pullback once RTY vs GOLD reverses, and we appear to be getting that first pullback right now. Let's wait and watch :D
Long post: Don't read if you don't want to.
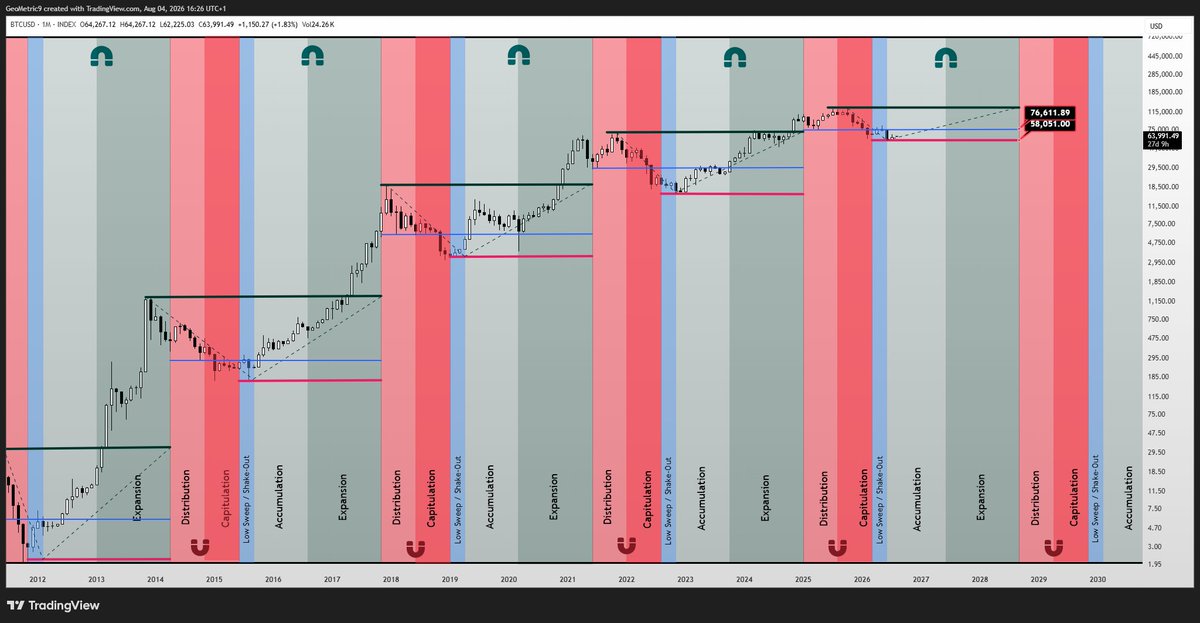
You know what I like about this $BTC chart? Every line drawn is rule-based, same method used to draw each line every cycle with absolutely zero subjectivity.
I've just added the blue line using another simple rule: the lowest point of the last distribution phase according to the time slabs, projected into the next cycle.
Looking at past cycles, it's apparent that this level is THE initial level to get through following the bear market.
This cycle so far looks pretty similar to the 2015 bear with an initial retrace and rejection at the blue line followed by a visit to the lows during the low sweep / shake-out window.
2022 and 2012 saw a few months of consolidation right beneath the blue line and a breakout coming later.
2019 saw a retake of the blue line early on, but a sharp correction mid-cycle (Covid) into the value area, but closing above the blue line.
This cycle, after the first bull run with no expansion (mean-hugging) and as I had anticipated, saw the shallowest correction at least during the capitulation phase. As per my read of this chart, if it has the same potency as it has had since 2011, 40k bears have run out of time. They were given the same opportunity in terms of time, as every previous cycle. October is deep into the next accumulation phase as per this chart.
As a result of the lack of expansion to the upside, and a lack of a deep correction to the downside, we are left with a very tight zone for possible accumulation between the current lows of 58k and the blue line at 76.6k
Imagine consolidating within this tight zone for an extended period? That would drive everyone nuts. It's already our 6th month running within these levels. Frankly, I do not see this happening for too long.
So what I deem most likely to happen next is a 2019 style break above the blue line and a consolidation above it and a potential dip into value mid-cycle. That Definitely gives it more room above this tight range.
We could also continue to follow 2015 and get a mean hugging run until we reach the expansion window.
For now, my eyes are on these two levels. The 58k lows to hold and the 76.6k resistance to break.
Crypto is FINISHED!
But whenever something is ending, something else is beginning. Let's see what - the chart is TOTALES (all cryptos excluding BTC and stables).
We will study:
1. Ichimoku: the only indicator that projects something in the future, not only the past
2. The RSI: the only oscilator that can bring similarities with 2021/22
3. The BIG gains: after the reversal, it doesn't last that much until the biggest move starts
4. The psychology: the one that will wreck even the ones who will make millions
1. Ichimoku
- every bear market cycle, after the kumo cloud starts to thicken, the reversal is about to start
- the chikou span (not in the pic) is actually meeting the price from February (BIG volatility move incoming - I think up, then correct again hard)
2. The RSI story
- you haven't got any similiarities in 2018, but you can find them in 2021/22, with some caveats
- the fastest push with the most gains was into 1. position on the RSI, from COVID to 2021, and from Oct 2023 to March 2024
- after that we had 2 more pushes on the RSI, with a 5th wave and the corrective movements (sideways, no gains, distribution)
- same at the bottom: 3 pushes, no downside pressure (sideways, no more gains for sellers, accumulation)
CAVEATS: the past cannot predict the future, but it can help you see similarities with these caveats
- the 3 pushes to 2021 cycle top happened fast
- the 3 pushes to 2022 cycle bottom happened slow
as opposed to
- the 3 pushes to 2025 cycle top happened slow
- the 3 pushes to 2026 cycle bottom happened [...]
Market structure does not repeat, but it loves some alternation. Remeber this to future caveats we'll talk about.
3. The BIG gains
- they happened inside the first push of the RSI - the most powerfull delivered the fastest gains
- it doesn't mean that you could not make money afterwards, but it does mean that this is when you get out most of your money
- if the RSI story is a short one this time, remember that this comes fast and swift, when it comes
- the most money will come AFTER this big push - so I will be out early, just like 2024
4. The psychology - the MOST important part!
- everyone's expectations are now very low: doing LTF trading, "if it does a 3x I will sell all bro", " it cannot even to pump to 2022 lows bro" etc etc
- I had very low expectations (inventor of the halfcoin season theory) this cycle, mostly if I got 5-7x I got out most of my positions, some of them 15x'ed, others just 4x, some positions I kept for longer which was a mistake etc.
BUT
Now I got my expectations very high, and that's not the problem.
The problem imo is when those that are still here start making 30-40-50x on strong projects, even after we sell, what are we buying after bro? Imagine buying a 50 cent coin, it reaches 30$, you sell it all
Then you wait for a 60-70-80% correction to add again? or leave it alone and find other stuff that has not pumped? You just start diluting your profits?
You buy real estate? Its cycle is almost at the end also.. Start a small business? It's a big company world now and it is accelerating
NOTE: I have 10 years experience with small/medium businesses in Romania, I got out in 2024 when I saw this trend. I was trying to become big fast, or else be taken out of the market - this is a trend that will continue, FASTER!
Dealing with 3-5-7x was easy, cause I already knew the plan to reaccumulate later, like $LINK or $CRV or $VELO or so many other charts
How do you plan to remain in the market, in what, when, how, when your charts start doing 30-40-50-150x? I cannot even plan for that, really.
Give me 3-4-5-6x forever, correct, then head back to support, buy again, rinse repeat. It's easy. The hard part is the other one imo.. I cannot plan for after
That's why I'm writing this post, to remember points 1, 2 and 3, and because from 2024 there were high expectations in the market, now everyone's expectations got obliterated.
"I can't take it anymore.."
"Just give me break even bro.."
Remember this is NFA, this is for my personal education and learn from my mistakes, and maybe it helps you. It's free.
Use it or.. you know.. don't
Will update later.
- Bear Hitler
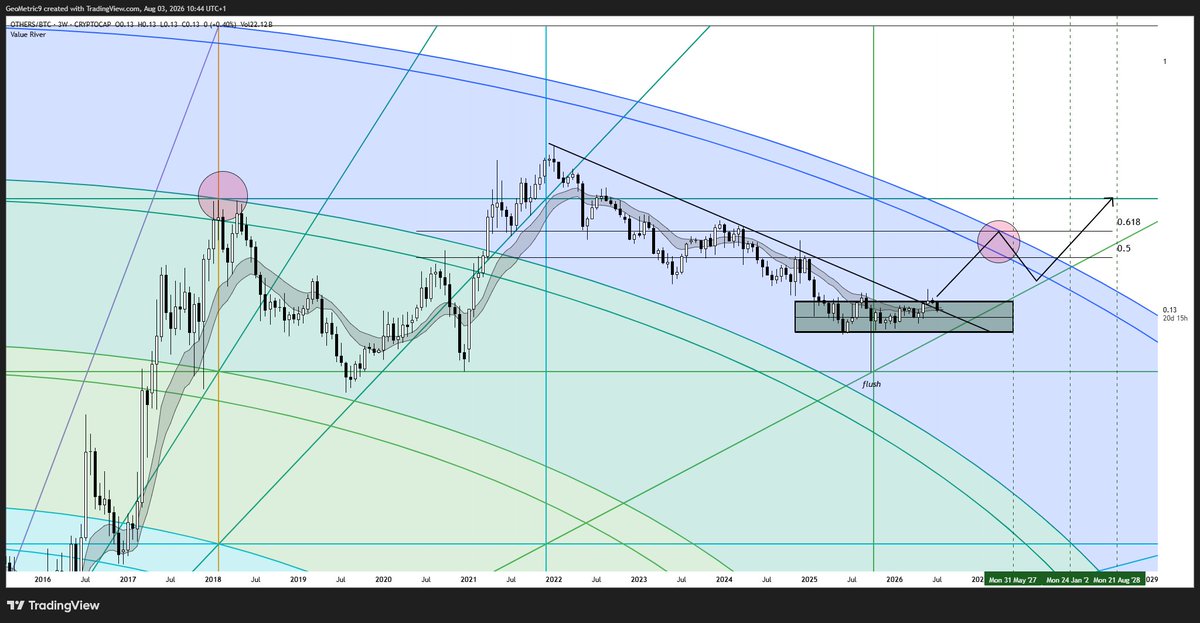
$OTHERSBTC finally broke out of it's downtrend line going back to 2022 and retested the line on the 1 week, 2 week and 3 week candle close yesterday and held above the support band. It had briefly wicked above the macro accumulation range going back to Feb 2025.
If this was indeed a successful retest, the next couple of weeks could be pretty bullish for alts.
Quoted post was last month on the verge of the monthly candle close for June when $BTC was at the bear market low and closed the monthly at the low. That post took courage and conviction to post such a call right at the very low.
Using the time chart and looking at what unfolded every previous cycle at the end of the 'capitulation' window, I asked subs to look for the lows holding and BTC latching on to the next diagonal with dips below it presenting the value area opportunities on the next run-up.
Remember that I posted this while at the lows and these macro charts take time to play out. This is not a guarantee but a point of reference based on what has played out during all previous cycles like clock-work.
In the quoted post, I even promised that should this quarter close in a red candle, I will completely stop posting my geometric approach publicly.
Nothing has changed since last month, and the latest monthly candle only supports my thesis so far. Only a new low would break it.
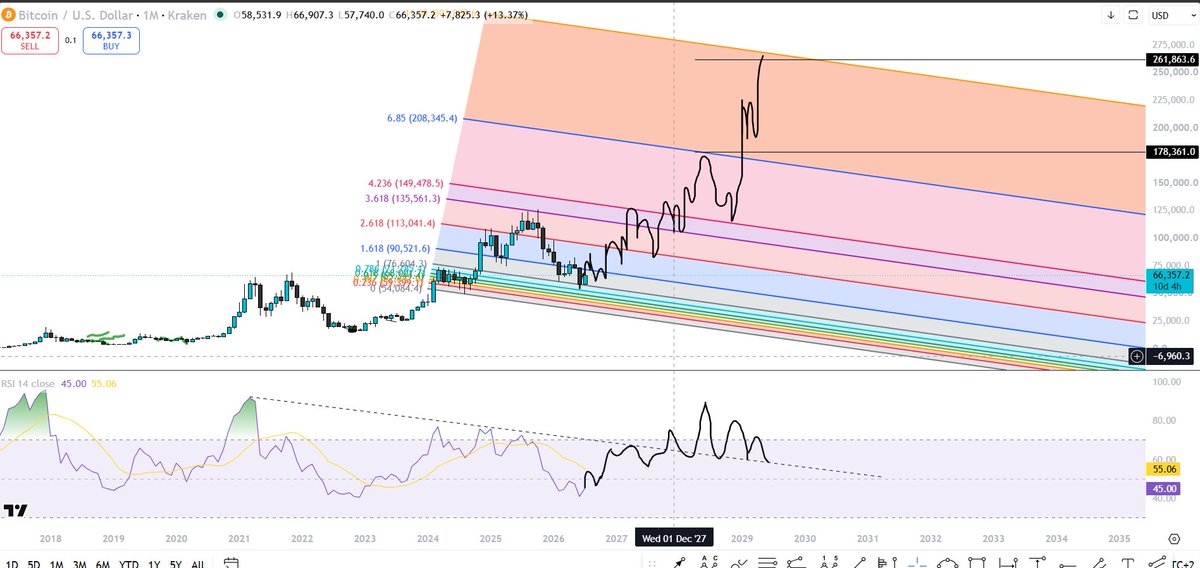
Sometime between June and October of 2027, Bitcoin will be trading well above 150k—most likely between 200k and 300k.
Ethereum will trade somewhere between 6k and 10k.
And quality Altcoins will be re-priced much higher.
Take that to the fucking bank. Save this post.
Weather this fucking storm, and you will be rewarded. I’m telling you.
These clown bears have no idea the opportunity they are fading. They will all delete their posts. Many will delete their accounts.
$BTC
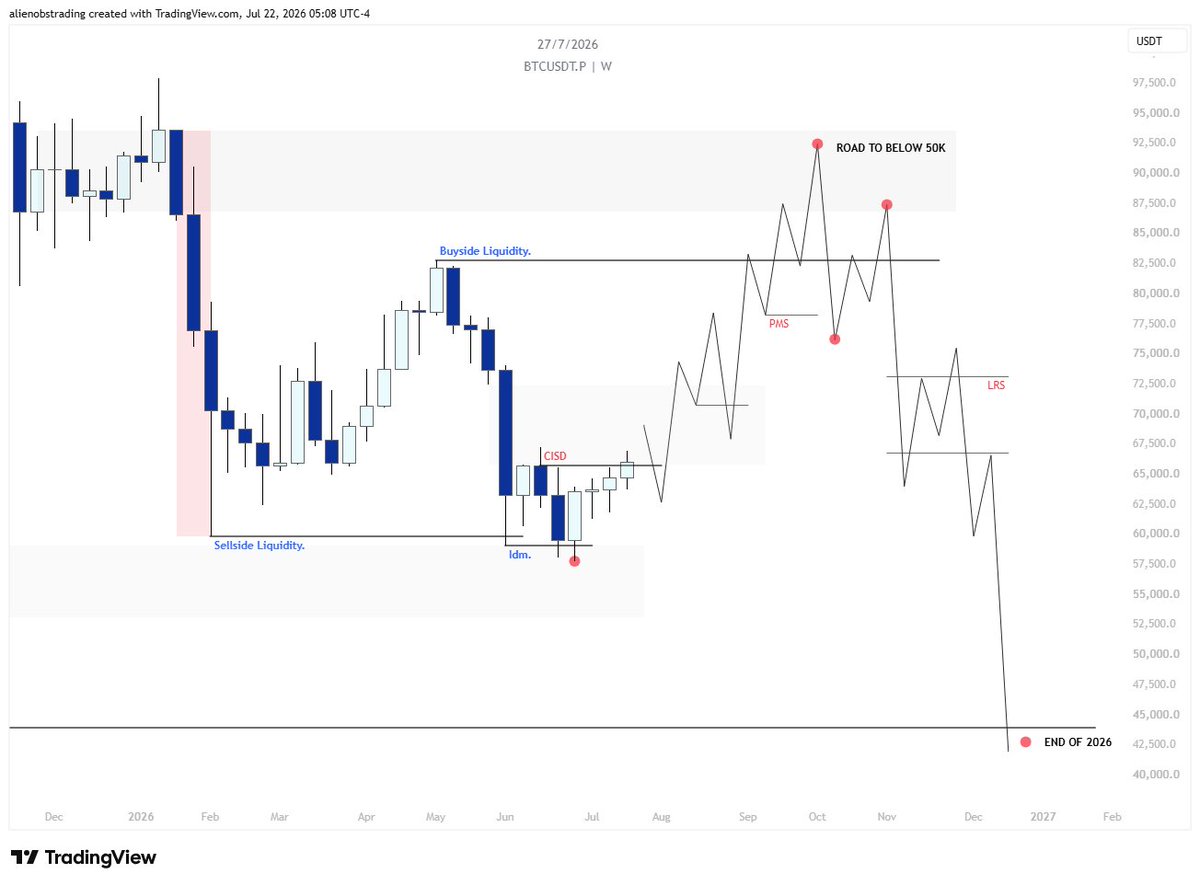
For the remainder of 2026, I believe a price path like this is a realistic possibility.
The key requirement is a confirmed CISD, followed by bullish continuation.
At first, many participants may conclude that "the bottom is in." However, in this scenario, the upside serves a different purpose: harvesting liquidity, completing the macro discount-to-premium cycle, and setting the stage for the real capitulation after a premium sweep.
I've tried to make the roadmap as clear as possible. Every major move on the chart is explained and supported by its underlying reasoning.
I know this isn't the type of price action CT is expecting, which is exactly why I find it interesting.
That said, the higher-timeframe structure still looks weak. A bullish continuation is less likely than a bearish resolution, but if the required conditions are met, it remains a valid possibility. Market makers rarely reward the consensus.
Under this scenario, ETH and altcoins could continue to outperform BTC, giving room for a meaningful mini bullszn before the macro trend resumes.
My long-term view remains unchanged: I still believe $BTC has a high probability of trading below $50K before the end of 2026.
Warren Buffett plans to offload his entire remaining stake in Berkshire Hathaway over the next eight years, culminating in a complete exit by December 31, 2034, per YF
Found an interesting pair right here, the OTHERS/GOLD chart looks like it wants to follow the ETH fractal from previous years. Everything has been spot on so far, and even now by holding around the 21 EMA and showing strength in altcoins, it looks like it wants to develop further. So I’d say keep your eyes open, because there are signs everywhere that altcoins want to outperform other asset classes in the years to come, including Bitcoin.








![ChifoiCristian's tweet photo. Crypto is FINISHED!
But whenever something is ending, something else is beginning. Let's see what - the chart is TOTALES (all cryptos excluding BTC and stables).
We will study:
1. Ichimoku: the only indicator that projects something in the future, not only the past
2. The RSI: the only oscilator that can bring similarities with 2021/22
3. The BIG gains: after the reversal, it doesn't last that much until the biggest move starts
4. The psychology: the one that will wreck even the ones who will make millions
1. Ichimoku
- every bear market cycle, after the kumo cloud starts to thicken, the reversal is about to start
- the chikou span (not in the pic) is actually meeting the price from February (BIG volatility move incoming - I think up, then correct again hard)
2. The RSI story
- you haven't got any similiarities in 2018, but you can find them in 2021/22, with some caveats
- the fastest push with the most gains was into 1. position on the RSI, from COVID to 2021, and from Oct 2023 to March 2024
- after that we had 2 more pushes on the RSI, with a 5th wave and the corrective movements (sideways, no gains, distribution)
- same at the bottom: 3 pushes, no downside pressure (sideways, no more gains for sellers, accumulation)
CAVEATS: the past cannot predict the future, but it can help you see similarities with these caveats
- the 3 pushes to 2021 cycle top happened fast
- the 3 pushes to 2022 cycle bottom happened slow
as opposed to
- the 3 pushes to 2025 cycle top happened slow
- the 3 pushes to 2026 cycle bottom happened [...]
Market structure does not repeat, but it loves some alternation. Remeber this to future caveats we'll talk about.
3. The BIG gains
- they happened inside the first push of the RSI - the most powerfull delivered the fastest gains
- it doesn't mean that you could not make money afterwards, but it does mean that this is when you get out most of your money
- if the RSI story is a short one this time, remember that this comes fast and swift, when it comes
- the most money will come AFTER this big push - so I will be out early, just like 2024
4. The psychology - the MOST important part!
- everyone's expectations are now very low: doing LTF trading, "if it does a 3x I will sell all bro", " it cannot even to pump to 2022 lows bro" etc etc
- I had very low expectations (inventor of the halfcoin season theory) this cycle, mostly if I got 5-7x I got out most of my positions, some of them 15x'ed, others just 4x, some positions I kept for longer which was a mistake etc.
BUT
Now I got my expectations very high, and that's not the problem.
The problem imo is when those that are still here start making 30-40-50x on strong projects, even after we sell, what are we buying after bro? Imagine buying a 50 cent coin, it reaches 30$, you sell it all
Then you wait for a 60-70-80% correction to add again? or leave it alone and find other stuff that has not pumped? You just start diluting your profits?
You buy real estate? Its cycle is almost at the end also.. Start a small business? It's a big company world now and it is accelerating
NOTE: I have 10 years experience with small/medium businesses in Romania, I got out in 2024 when I saw this trend. I was trying to become big fast, or else be taken out of the market - this is a trend that will continue, FASTER!
Dealing with 3-5-7x was easy, cause I already knew the plan to reaccumulate later, like $LINK or $CRV or $VELO or so many other charts
How do you plan to remain in the market, in what, when, how, when your charts start doing 30-40-50-150x? I cannot even plan for that, really.
Give me 3-4-5-6x forever, correct, then head back to support, buy again, rinse repeat. It's easy. The hard part is the other one imo.. I cannot plan for after
That's why I'm writing this post, to remember points 1, 2 and 3, and because from 2024 there were high expectations in the market, now everyone's expectations got obliterated.
"I can't take it anymore.."
"Just give me break even bro.."
Remember this is NFA, this is for my personal education and learn from my mistakes, and maybe it helps you. It's free.
Use it or.. you know.. don't
Will update later.
- Bear Hitler](https://pbs.twimg.com/media/HOu1YBwXEAAGsb2.jpg)