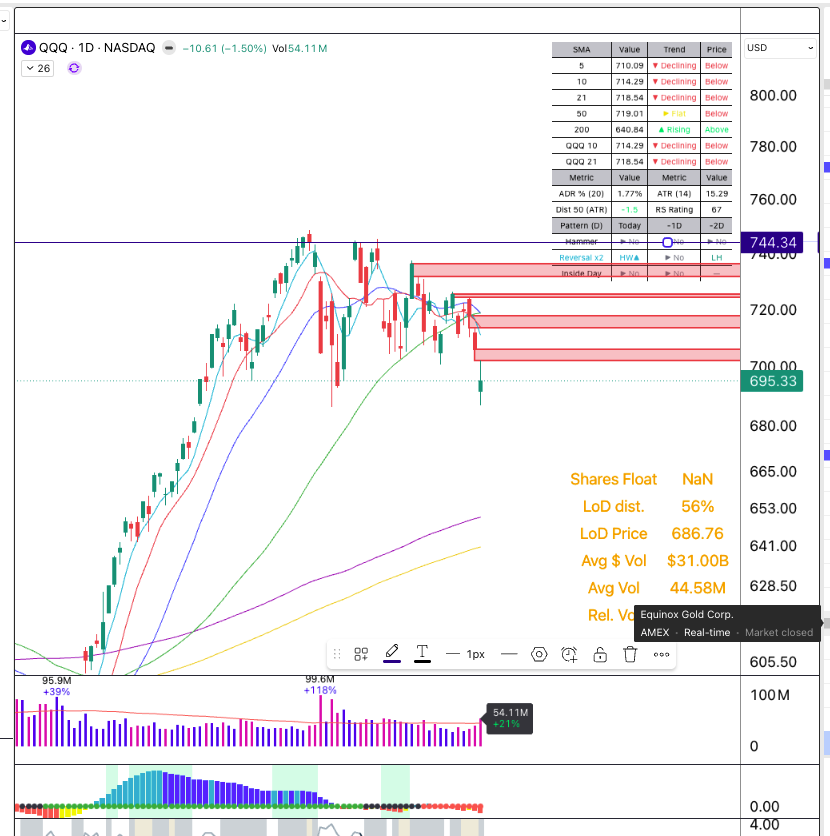
$QQQ
Double TOP Short has highest possible risk reward ratio, may take few attempts but if you can keep at it, man oh man
after breakout this set up is my FOCUS to know in and out
key concept is
watch like HAWK day and day out
Clear Thesis framed out
Very precise
La seule phrase qui est universellement vraie est celle-ci: tout le monde dans l’écosystème ne peut pas maintenir 80%+ de gross margin.
Car dans un marché en forte croissance, tout le monde peut être gagnant, juste à différents degrés et à différentes amplitudes (pour donner un exemple: est-ce qu’on peut dire qu’un acteur qui divise par deux sa part de marché dans un marché qui triple en volume est un perdant ?)
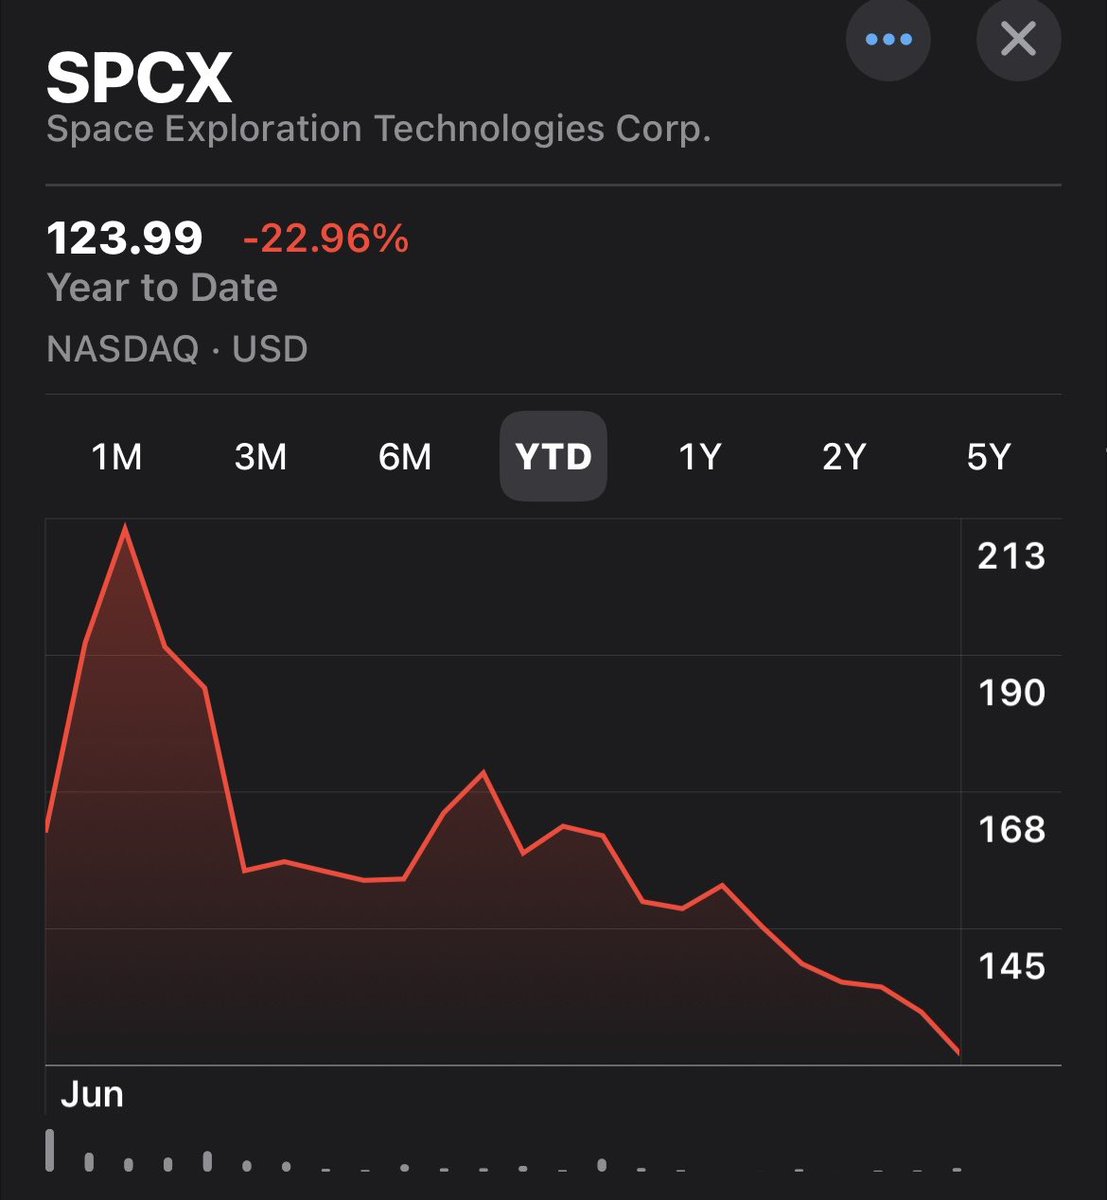
Elon advierte que las empresas que están shorteando $SPCX en un porcentaje significativo tienen muy bajas chances de sobrevivir.
Veremos en un tiempo si tuvo razón.
Nunca es buen negocio ir en su contra.
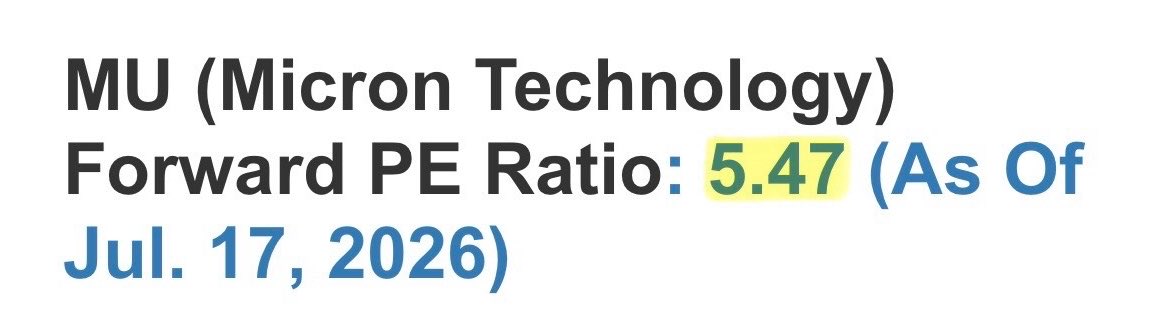
$MU forward PE ratio is 5.47
JP. Morgan projects AI memory share as a percentage of CSP capex to be 73% in 2027
Figure around $700-$800 billion at current capex projections
Investors ask me: when are high-growth stocks cheap enough to buy? How can I value them?
Here is how I do it.
For me, these stocks are not about the potential upside but about the potential downside. Take $ASTS as an example.
I always start by doing a reverse DCF analysis. I see a lot of comments that a reverse DCF is impossible on high-growth companies, but in my opinion, it gives you valuable insights.
For $ASTS, for example, they should be able to reach $2.86B in free cash flow to justify the current valuation. AST has a negative free cash flow at the moment and a revenue of $84.9 million. They don't have to reach it now, but if I want a 10% return each year from today's price, they should reach it in 2036.
How realistic is this?
I look at three major things: Full Potential, TAM, and SAM of the company. The full potential is what the company can reach in revenues without competition and with all the necessary equipment. The TAM is the total market demand for the service if there were no constraints with the current business model and products, and the SAM is the portion of the TAM that ASTS can actually reach.
A quick look at the Direct-to-Device market and you'll find that the forecast of the market is between $140 and $200 billion annually by the mid-2030s. If we look at the SAM,$ASTS already has an existing pool of nearly 3 billion subscribers via partners. Deutsche Bank analysts estimate 1.75 billion mobile users willing to pay for extra satellite services by the mid-2030s.
If AST SpaceMobile reaches an average market share of 35% and people pay around $2.5 extra/month for satellite services, you get a revenue of $18.37 billion. A realistic free cash flow margin for this kind of business model in a mature state fluctuates around 45% and 55%, so let's take 50%. The free cash flow would be $9.19B; the target looks highly realistic here.
I just want to warn you: these kinds of calculations always look very bullish for high-growth stocks, as you completely take out the execution risk. That is why I think the downside for stocks like these is way more important to look at.
So, how do you calculate the downside?
First thing I look at is the balance sheet. How much cash does the company have, what is the total debt, and what are the short-term liabilities?
For AST SpaceMobile, they have $3.5 billion in cash and cash equivalents. They also have $2.5 billion in other assets, pushing the total asset value just past the $6B mark. The downside is that they carry $3.4 billion in total liabilities, the vast majority of which is tied up in $3.0 billion of long-term debt. They also have a $1.41 billion burn rate at this level.
Management has a guidance of $150m to $200m in 2026, and a target of $1 billion in 2027. This should lower the burn rate rapidly.
AST also has some execution risks such as launch bottlenecks, manufacturing scaling, and heavy competition from Starlink.
I honestly don't see a protected downside here like I do with $PL, for example. With this burn rate and debt, there is no safety net for the stock to fall to. It's a very aggressive stock with a lot of execution and financial risks.
In this example, I'm happy to wait until the financials get a little bit better to recalculate my risk/reward.
$BRENT remains in a corrective recovery from the July low, with the broader structure still favoring an ABC rally within a larger correction. One more high stays possible into or slightly above the $85 to $88 resistance before the recovery completes.
A break below $82.79 would raise the odds that a corrective top is already in place.
History suggests the market's toughest stretch is just ahead. Since 1990, August and September have been the weakest months of the year, with September posting average losses across the DJIA, S&P 500, and NASDAQ. Stay alert as the #SummerRetreat begins. https://t.co/JbEMvhyzyT
A bearish Kimi K3 argument:
“If enterprises get to use best frontier model while keeping their data in house, why would they EVER use Anthropic and give away their data?
What's scarier is if Huawei became the status quo for chips.”
This fact has been an unmovable object in my mind the whole time.. I feel like many are mid-witting the Fed, overthinking something that is really not complicated at all, barring some massive inflation spike or something like that.