Many of you asked what the ~200 investable companies actually are.
Hohn won’t publish his list.
Here are 50 names that fit his framework.
Real moats, irreplaceable assets, pricing power above inflation. The hunting ground.
AEROSPACE & ENGINES (duopolies, IP, installed-base lock-in)
– GE Aerospace
– Safran
– Rolls-Royce
– Airbus
– TransDigm
– HEICO
– MTU Aero Engines
– Howmet Aerospace
PAYMENTS NETWORKS (network effects, “toll roads on commerce”)
– Visa
– Mastercard
– American Express
RATINGS, DATA & EXCHANGES (regulatory and natural-monopoly moats)
– Moody’s
– S&P Global
– MSCI
– Intercontinental Exchange
– CME Group
– Deutsche Börse
– London Stock Exchange Group
– Experian
– Equifax
– Fair Isaac (FICO)
AIRPORTS, TOLLS & CONCESSIONS (irreplaceable physical assets, regulated dual-till)
– Aena
– Ferrovial
– Vinci
– Eiffage
– Getlink (Channel Tunnel monopoly)
– Flughafen Zürich
– Grupo Aeroportuario del Pacífico
– Grupo Aeroportuario del Sureste
– Auckland Airport
– Transurban (Australian toll roads)
RAILS (natural monopoly networks, irreplaceable rights of way)
– Canadian National Railway
– Canadian Pacific Kansas City
– Union Pacific
– CSX
– Norfolk Southern
TOWERS & ESSENTIAL INFRASTRUCTURE (irreplaceable physical sites)
– American Tower
– Crown Castle
– Cellnex
– SBA Communications
ESSENTIAL SERVICES (permits, route density, switching costs)
– Waste Management
– Republic Services
– Veralto
– Ecolab
– Rollins
INDUSTRIAL GASES (oligopoly, irreplaceable on-site infrastructure)
– Linde
– Air Liquide
– Air Products
SEMICONDUCTOR INFRASTRUCTURE (irreplaceable IP and capital intensity)
– ASML (lithography monopoly)
– TSMC (leading-edge foundry monopoly)
– Tokyo Electron
CONSUMER & MISC (membership economics, real installed base)
– Costco
What unites them: high barriers to entry, pricing power above inflation, decades of installed-base lock-in, and businesses that an AI agent cannot replicate in a weekend.
What’s missing: every bank, every airline, every auto, every traditional retailer, almost all SaaS, every wireless telecom, every advertising agency, every fossil fuel utility, every luxury brand, almost all of pharma, almost all of life sciences tools. The exclusion list does more work than the inclusion list.
The list isn’t the alpha. The framework is. Find businesses where the moat is physics, regulation, scarcity, or installed base. Not code. Hold them for 8 years. Don’t trade.
That’s the game.
The following table highlights the companies most widely held among the ten prominent funds analyzed in my latest Superinvestor research report (as of March 31, 2026).
When multiple quality-oriented investors independently arrive at the same business, it serves as a powerful form of distributed due diligence, signaling strong fundamental alignment.
Read here (or link in bio): https://t.co/2BbMYshP8f
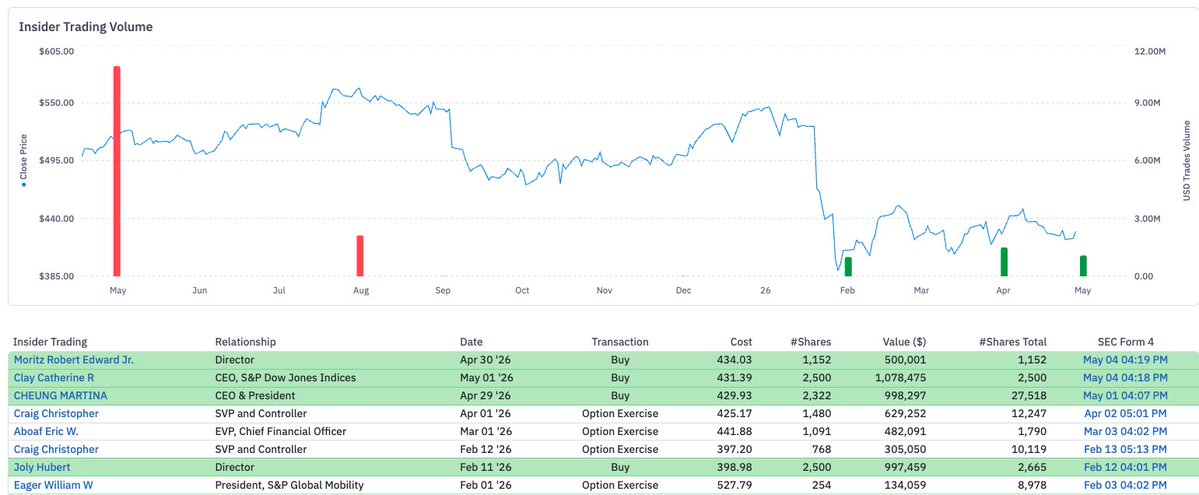
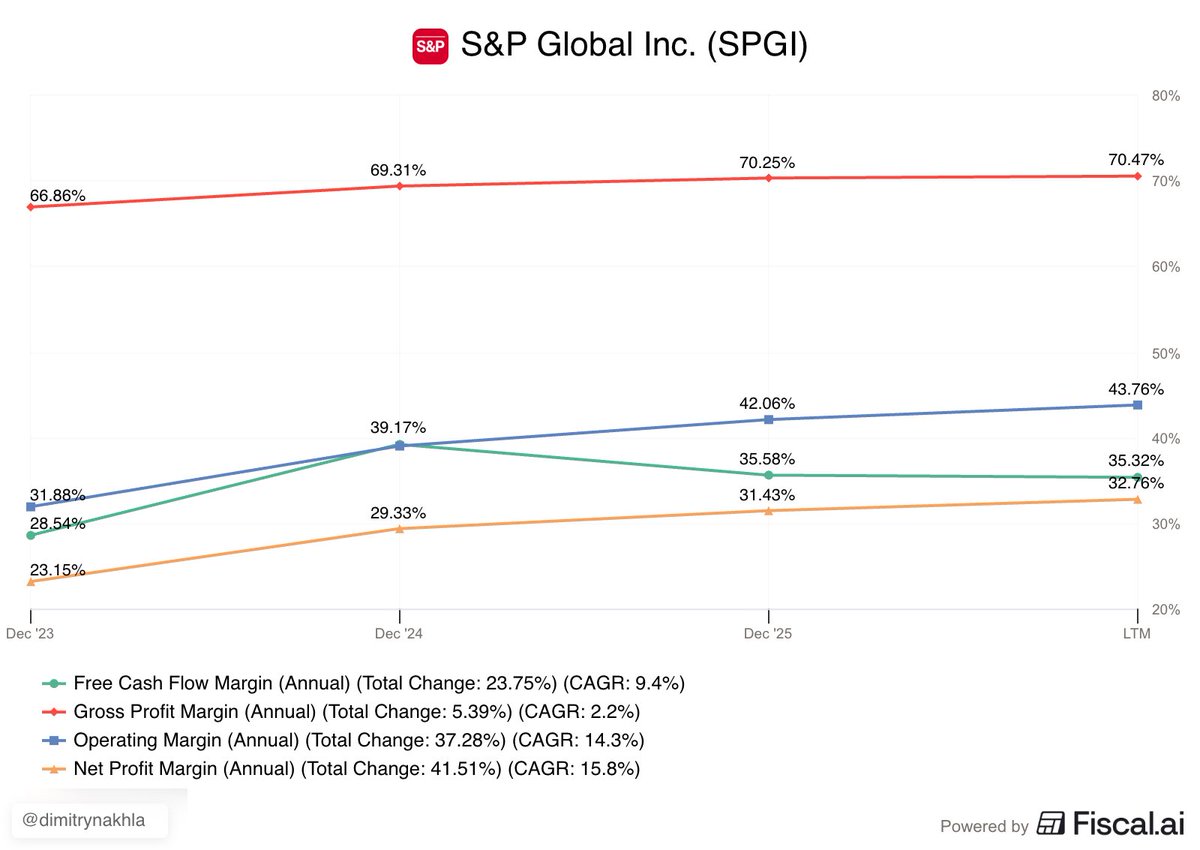
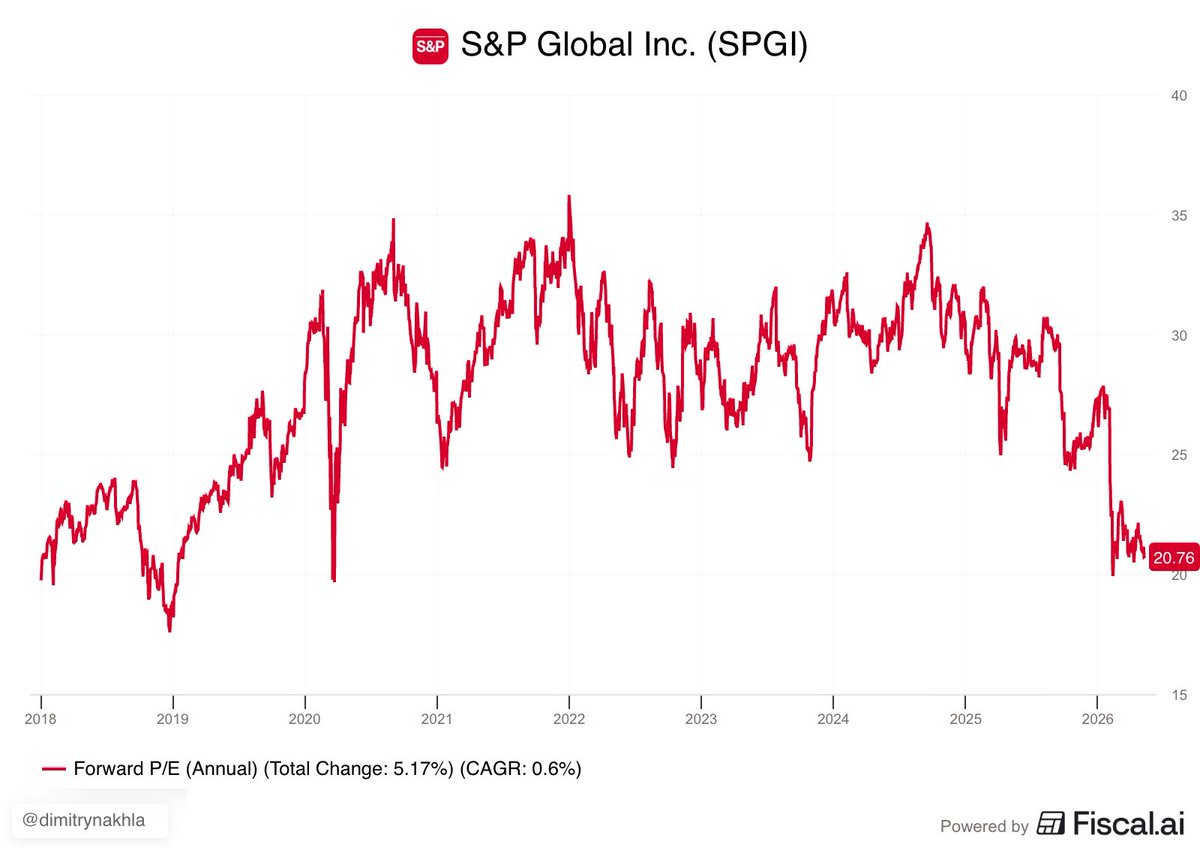
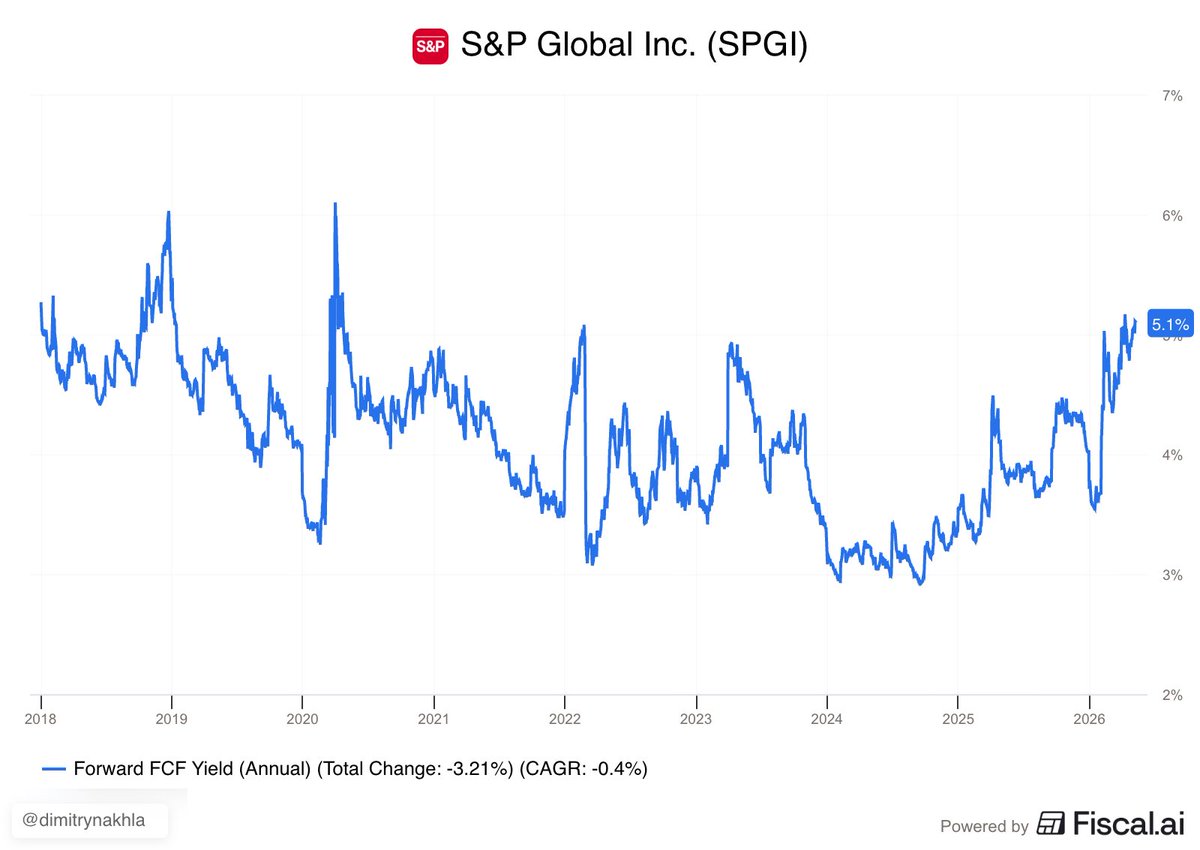
S&P Global $SPGI is worth keeping an eye on
• 21x & 5.10% FCF Yield (NTM)
• Gushes FCF with a 35% FCF Margin
• Returning FCF back to shareholders with aggressive buybacks near decade-low valuations
• Insiders accumulating shares in the open market
• Wise divestitures
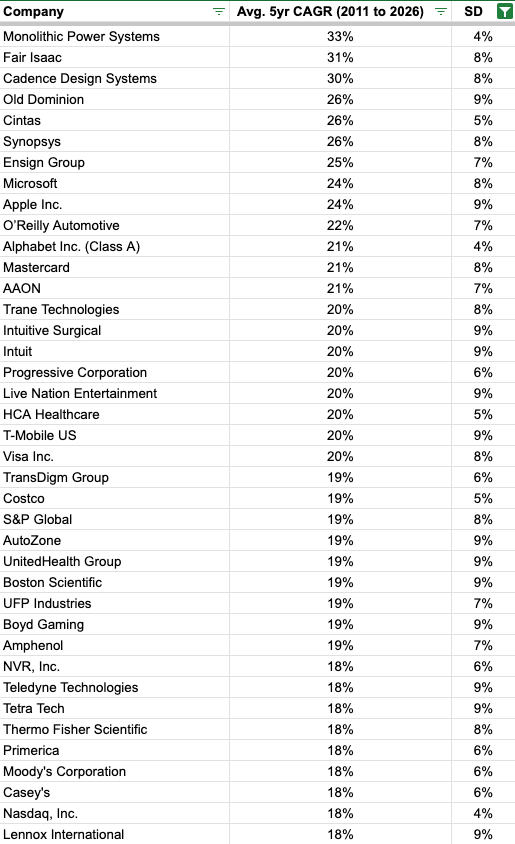
This table is a gold mine.
Here's a list of companies that have grown their share price over the last 15 years - not only rapidly, but also with consistency.
⬇️⬇️⬇️
From this list I own Fair Isaac, Cadence, Mastercard and Visa.
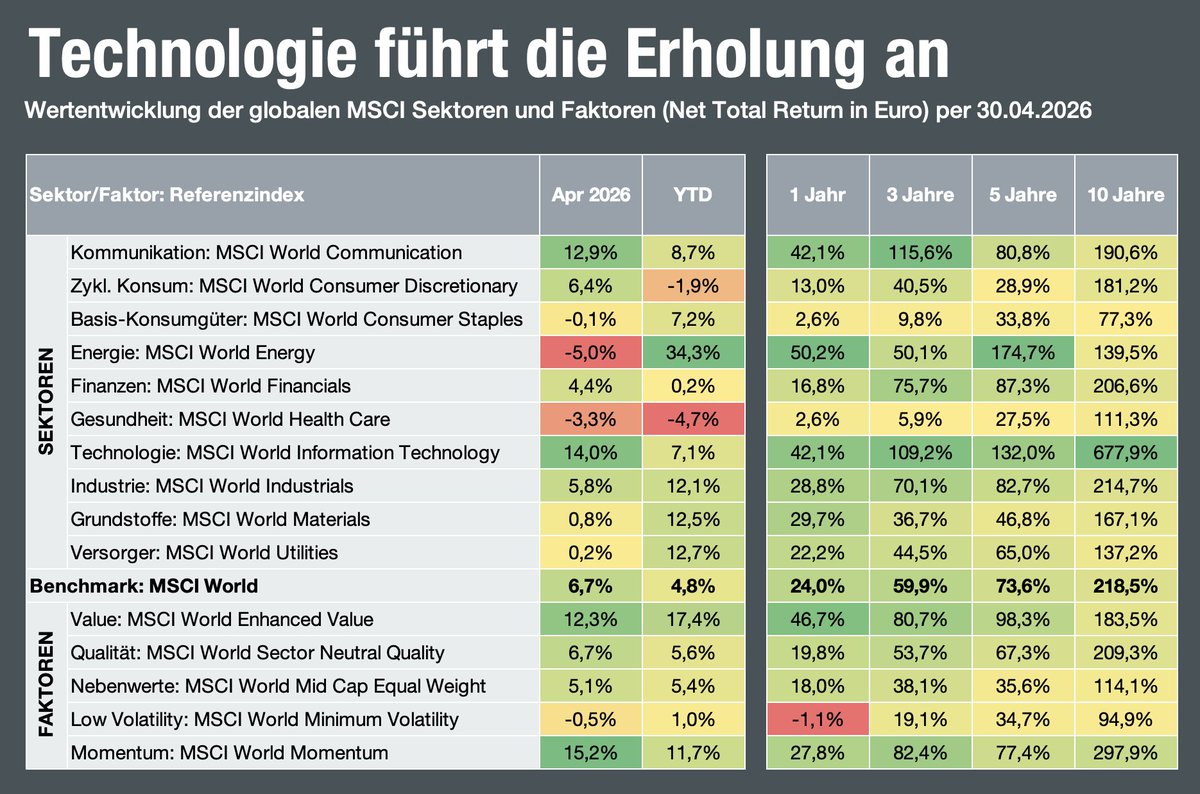
Die Tech-Branchen IT und Kommunikation im April mit mächtig Auftrieb – aber "year to date" sind einige Sektoren deutlich stärker: Energie, Industrie, Grundstoffe, Versorger.
Bei den Faktoren glänzen weiterhin Value und Momentum.
This is literally the most extreme momentum event in 40 years of recorded data. The Nasdaq 100's RSI went from 28 (oversold) on March 30 to 70.5 (overbought) by April 15 — in just 11 sessions. That is the fastest oversold-to-overbought transition in the Nasdaq 100's 40-year recorded history. The previous fastest was 25 sessions after Liberation Day last year. The historical average is 60+ sessions. Benzinga
According to Bespoke Investment Group, this also marks the fastest move from a correction of this size to a new record high since 1928. Yahoo Finance
The forward return data is actually quite bullish long-term. Across all 44 historical episodes where the Nasdaq gained 11% or more in 10 sessions, the 12-month forward return averaged +24%, with a median of +30%, and a win rate of 80%. At 6 months, the win rate is 74%. Benzinga
But the near-term pullback is almost guaranteed. The average maximum drawdown following these signals was −18.39% — meaning while the 12-month destination is historically higher, the journey involves deep, punishing pullbacks that can severely impact over-leveraged portfolios. Ainvest
The key number to watch: Based on the 6 most comparable historical analogues — COVID recovery (−8%), Liberation Day 2025 (−4%), Fed pivot 2018 (−6%), Asian crisis 1997 (−7%) — the most probable near-term pullback is 3-8% within the next 2-4 weeks. The April 22 ceasefire expiry is the most likely trigger. After that consolidation, the historical data overwhelmingly favors a resumption of the bull trend.
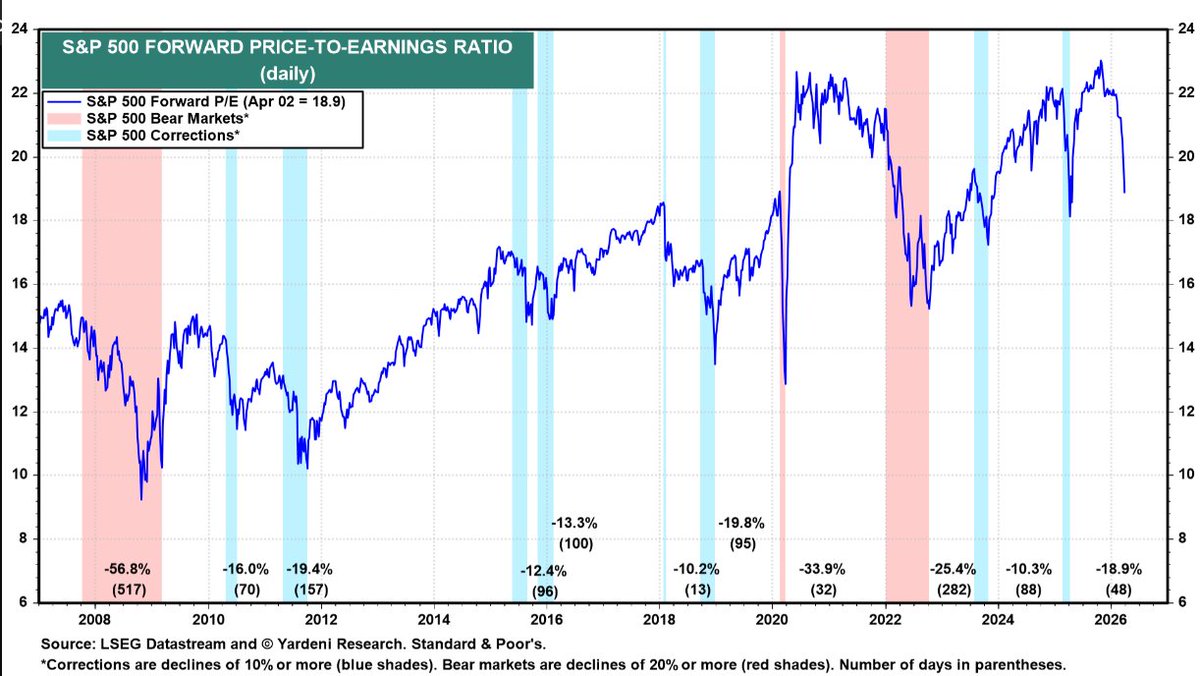
The S&P 500 has experienced average intra-year declines of roughly 14% since 1990, even in years that finish strongly positive — and the average correction (10-20% decline) lasts just 17 days. U.S. Bank
A pullback here isn't a disaster; it's the historical norm and historically the best re-entry point.
Wes and I are extremely well positioned in the leaders.
$HEI has been one of the best compounders of the last 3 decades. A $10K investment in 1990 is worth over $8M today. Listened to this interview with Co-President Eric Mendelson and its pretty clear why this has been such a strong business. The business model is very simple but extremely difficult to replicate. In 1990, HEICO was a struggling business with a ~$25M market cap. Management discovered a regulatory loophole to challenge aerospace OEMs. They used FAA regulation to engineer replacement aerospace parts. They proved to the FAA that their parts strictly matched the fit, form, and function of OEM parts. This broke the OEM pricing monopolies. They have shipped 85M parts with zero in-flight failures.
The capital allocation strategy is the secret sauce behind the stock. The Mendelson family runs the company, but they refuse to operate it like a traditional family business. Larry, Eric, and Victor Mendelson require a unanimous three-way vote for any major decision. If one says no, the deal dies instantly. This strict filter kills bad capital deployment. They have acquired 100 companies over the years. 98 of those acquisitions have been successful. They focus exclusively on businesses generating 20% or higher margins. They also run the balance sheet with extreme discipline. They try to target roughly a 1x debt-to-EBITDA ratio. This protects the equity from macroeconomic debt cycles.
HEICO operates like a highly decentralized portfolio. It does not run like a typical billion dollar aerospace behemoth. It runs as roughly 140 separate businesses. Each unit makes unde $100M and employs arround less than 100 people. Corporate buys companies led by great operators and leaves them completely alone. They do not force typical corporate integration or micromanagement. They also build extreme employee loyalty.
Their recent M&A execution proves the decentralized model scales very well. In August 2023, HEICO acquired Wencor for just over $2.05B from private equity firm. They paid almost 13x EBITDA. This was the highest multiple they ever paid for an asset. However, Wencor has outperformed expectations so aggressively that the effective multiple is now in the single digits.
Management also eliminates geopolitical risk. They refuse to manufacture anything in China. They actively protect their intellectual property from theft. Mendelson noted that China is at least 20 years away from matching western commercial aircraft technology, and engine technology parity will not happen in his lifetime.
Cars sold in 2025: 5-10 million. Actual: 1.6 million (and declining).
EV revenue: $234-367 billion. Actual 2025 total revenue: $95 billion (and declining).
Bear case insurance revenue: $23 billion. Actual: Undisclosed, likely < $1 billion.
Insurance profit: 40% pre-tax margin. Actual: Undisclosed. 40% is impossible. Most definitely negative.
Human/autonomous ride-hail revenue: $42-327 billion. Actual: Zero
Gross margin: 43-50%. Actual: 18%
EBITDA margin: 30-31%. Actual: 12%
Enterprise Value/EBITDA: 14-18x: Actual: 117x (LOL)
Market Cap: $1.5-4.0 trillion. Actual: $1.3 trillion (312x P/E)
Free Cash Flow Yield: 4.2-5.0%. Actual: 0.5%
ARK then published increasingly more optimistic “research” reports on Tesla in the subsequent 3 years (before giving up). The final 2024 report projected a $7.0-10.9 trillion market cap and $300 billion of annual free cash earned by 2029. While Tesla��s’ stock did rise 59% in the subsequent five years from the 2021 report (to a 312x P/E), the ARKK ETF lost 43%. The fact that ARK still has more than $10 billion of fee-paying investor capital despite destroying the majority of the billions that cascaded in near its 2021 peak remains a mystery. Perhaps it’s the ongoing more than 100 appearances on CNBC. Or the live TV prediction of earning 50% returns per year. Cumulative management fees total more than $600 million. And counting.
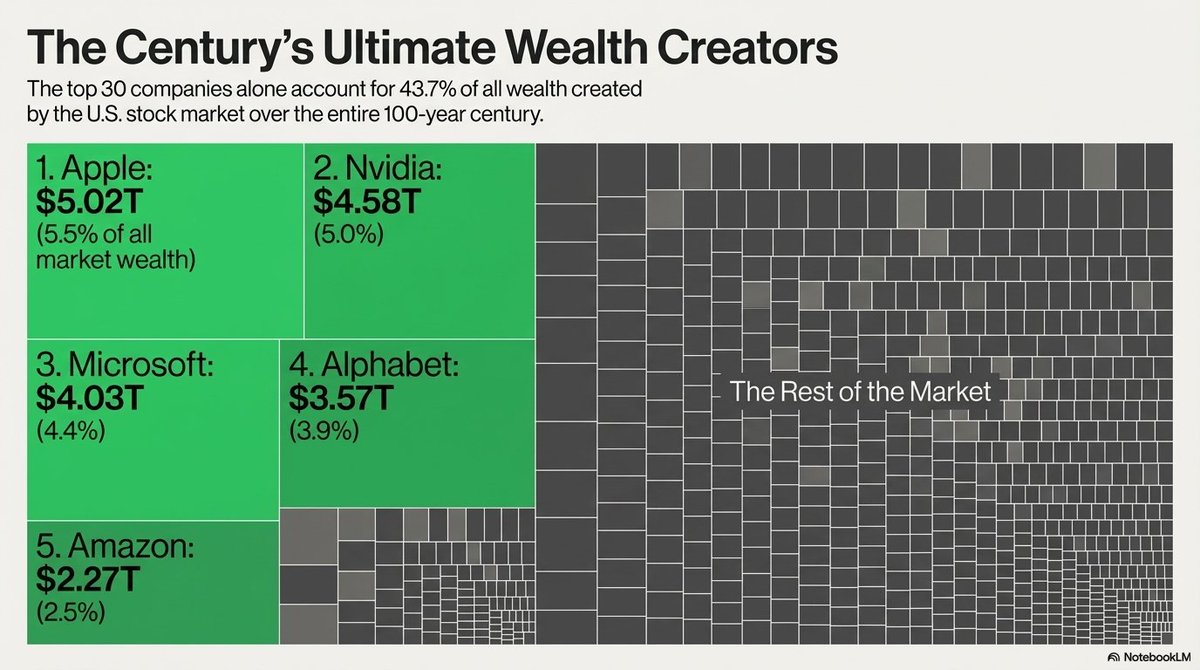
New paper from Hendrik Bessembinder just analyzed 100 years of stock market data.
And it's shocking.
Out of nearly 30,000 stocks analyzed...
just 30 companies generated ~44% of all wealth created.
👀
Professor Bessembinder has a new paper out (https://t.co/L5n8ioJPkO) which updates his 2018 study "Do Stocks Outperform Treasury Bills?" (https://t.co/KSqMLLaR8U). I was very interested in left-hand side of this table from the new paper showing biggest wealth creators since 2016.
🇸🇪 Lifco $LIFCO-B.ST is arguably the archetypal Nordic Serial Acquirer.
Lifco collects "Niche Kings." It owns 275+ companies that dominate markets you’ve never heard of.
The result: 17%+ EBITA CAGR for nearly 20 years. 📈 💶
The stock is down nearly 30% from all time highs but insiders are buying big!
Here is a thread on 10 of their wildest subsidiaries & why owning them is a masterclass in M&A: 👇🧵1/12
Industrials are priced for perfection.
These 6 industrial stocks are trading with sky-high multiples and may be overvalued:
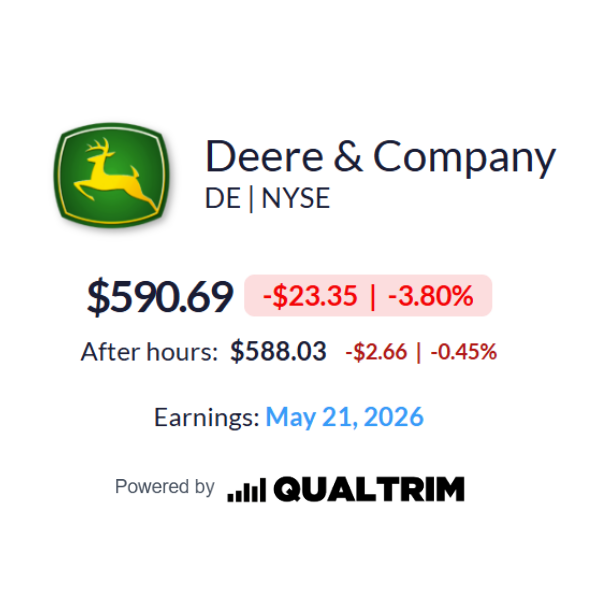
1. $DE: Deere & Company
- Multiple: 33.3x