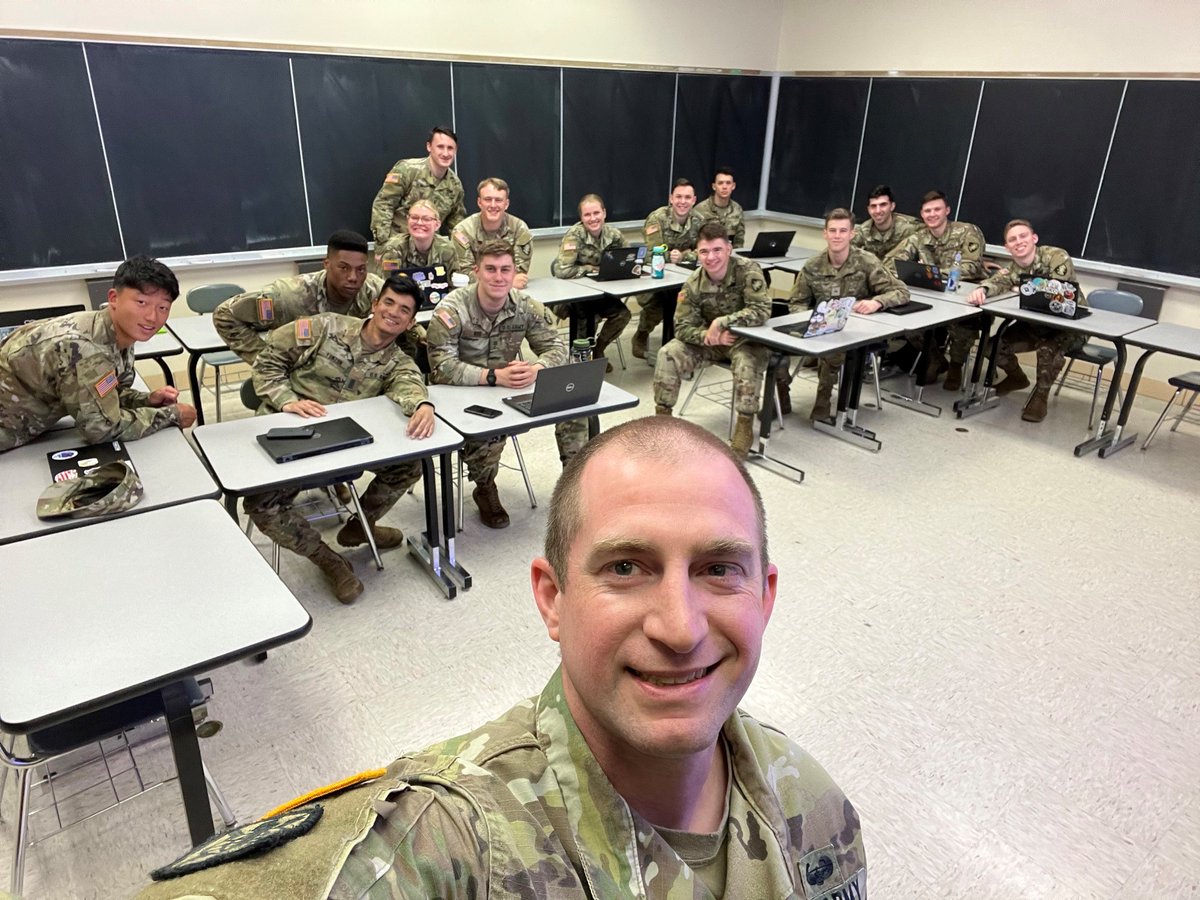
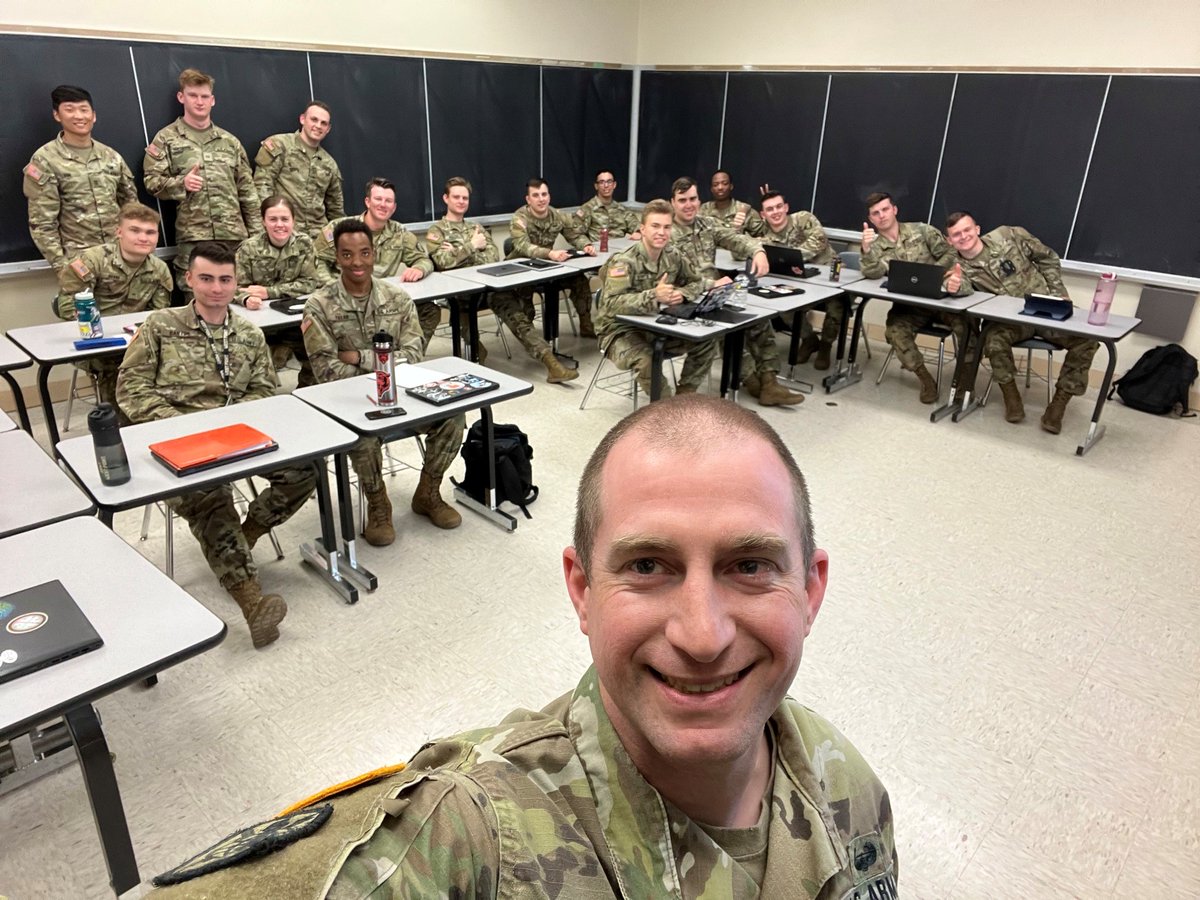
Yesterday, I taught a workshop on Dashboarding in R. I covered connecting RStudio to GitHub, creating dashboards in R, and hosting your dashboard as a website with GitHub Pages. Video Below:
https://t.co/tq4yOMFO3j
#RStats#Rmarkdown#DataScience#github#r4ds#dataviz
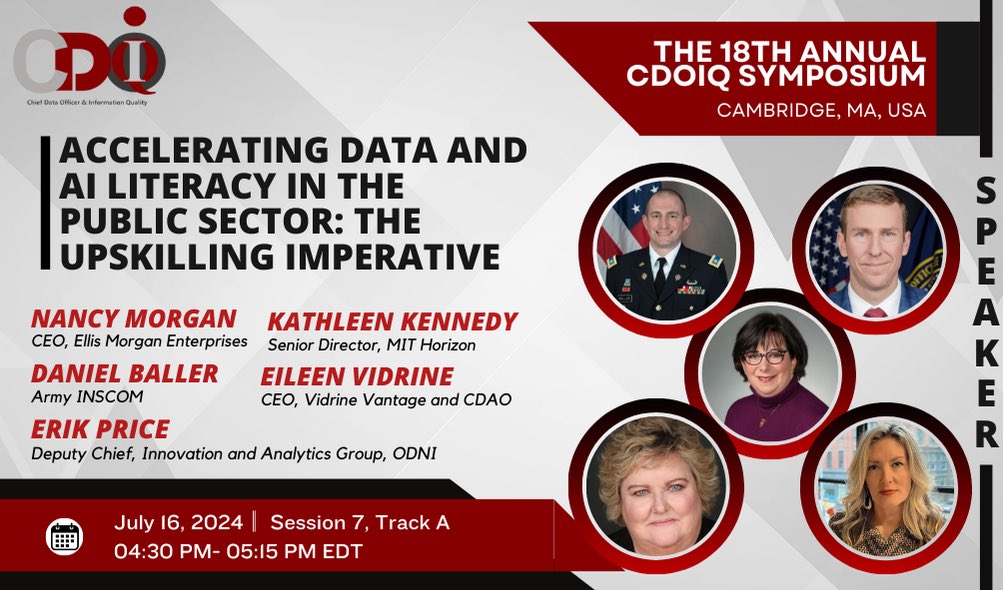
Check out our session this afternoon on Data and AI Literacy, upskilling the workforce, and leveraging public/private partnerships to build a culture of data-driven decision making.
#cdoiq2024#data#datascience#AI#analytics
@BillMakaka If you don’t want to go full shiny, flexdashboards are a great tool and are really easy to make if you are already working in R. Here is a workshop I ran last year that will walk you through the process.
https://t.co/EtB7CjLzbc
@statacake I ran West Point’s intro stats course for 2 years, both in base R and after switching to tidyverse. I’d definitely recommend using ggplot2 for the visualizations. Here is what we gave students as an into to tidy and ggplot2. https://t.co/TkQFeMOT5G
If you are attending ASN’s #NutritionLiveOnline check out my presentation on using dashboards for transparency and reproducibility in nutrition research at https://t.co/NjiO6hJwOf #RStats#r4ds#DataScience#research
Today I gave the last final to my Sabermetrics class, finishing my 4 years teaching at West Point. I feel lucky I was able to end my time here teaching our most R intensive course to 2 great classes. #RStats#highereducation
Yesterday, I taught a workshop on Dashboarding in R. I covered connecting RStudio to GitHub, creating dashboards in R, and hosting your dashboard as a website with GitHub Pages. Video Below:
https://t.co/tq4yOMFO3j
#RStats#Rmarkdown#DataScience#github#r4ds#dataviz
@FilmicAesthetic I'm glad you found it helpful. Once you start its hard to stop. I've made them to track everything from my workouts to sports betting.
@rvidal I have not tried deploying in a private space yet. One of the nice things about the dashboard is that it creates a stand alone HTML document that can be opened with any web browser. So you would be able to email the document out or hang it on an internal SharePoint.
Every year I run a NFL pick’em league in R for the West Point Math Dept and my students. This year our group predictions correctly picked over 61% of games for the season. Dashboard of results below. #RStats#NFL#Dashboard#dataviz
https://t.co/J9923JHuO3
This week our paper on Reference Percentiles for Bioelectrical Phase Angle in Athletes was published in Biology. I’m grateful for the opportunity to work with such an amazing team of researchers. https://t.co/w9O6yfKlo8 #bayesiananalysis#RStats#sportsperformance