The cumulative share of income is a valuable way to measure how wealth or income is distributed across a population. It provides insights into economic inequality and can guide efforts to create more balanced and fair systems. This metric is often used alongside tools like the Lorenz curve and Gini coefficient to better understand income disparities.
✔️ Highlights patterns of inequality: Measuring cumulative shares helps identify gaps in income distribution, enabling informed policy decisions such as progressive taxation or targeted social programs.
✔️ Tracks trends over time: This approach allows governments and researchers to monitor changes in inequality, assess the effectiveness of policies, and compare inequality levels across different regions or time periods.
❌ Potential for incomplete analysis: This method does not capture absolute income levels or multidimensional inequality factors (e.g., education or healthcare access).
❌ Overlooking group-specific issues: Aggregated measures may fail to reveal disparities within subgroups, such as geographic or demographic inequalities.
🔹 In R: Use the ineq package to compute the Gini coefficient and analyze cumulative shares. The reldist package can provide additional measures, such as relative distribution metrics for deeper analysis.
🔹 In Python: Leverage ineqpy for Gini calculations and matplotlib for plotting Lorenz curves. Use pandas and numpy for tailored analyses of specific data sets.
Want to explore more about statistics, data science, R, and Python? Subscribe to my newsletter for insights and updates! Check out this link for more details: https://t.co/ktUcWo9XpO
#database #Data #RStats
⚠️ Es muy probable que El Niño se manifieste en estos próximos meses. Podría alcanzar intensidad moderada o fuerte después de verano.
En unas zonas del planeta provocará olas de calor y sequías; en otras, lluvias torrenciales.
Pero, ¿afecta a España? 🤔
Sigue el hilo 🧵
The Iberian Peninsula is a prime example of a relentless population trend. Booming coastal lifestyle town and metropolitan areas, sharply declining regional areas. HT @milos_gis
The drop in birth rate in Europe is very concerning, with severe consequences for pensions, healthcare and real estate. But what is happening in Asia, especially China, is not a demographic crisis, it’s an implosion.
With women getting older, will it even be possible to reverse?
🌡️El calor de pleno verano que hemos registrado en España en los últimos días se ha notado también en el agua del mar.
➡️ Se han batido numerosos récords de mayo en el Cantábrico, el Mediterráneo y puntos de Canarias.
➡️ La boya de Mahón midió 26.6 °C el día 27.
Today I am posting Lecture 2 of my course on Geoeconomics at Oxford. It covers the history of the field and its open areas of research:
https://t.co/FPX74i0iEb
Since I am fond of the history of thought, I spent perhaps too many slides on it. But I have been reading about geoeconomics and grand strategy since high school. My love affair with the field began when I read Paul Kennedy’s The Rise and Fall of the Great Powers: Economic Change and Military Conflict from 1500 to 2000 in my junior year, and later, a book by two Spanish admirals that summarized the ideas of Alfred Mahan and Halford Mackinder. So I felt I could indulge myself.
I also treat the German-language tradition in detail, since it is less familiar to English-speaking readers. Carl Schmitt, for instance, has gained prominence lately, whatever one thinks of him.
One thing the slides leave out: in class, I spent a good deal of time outlining ideas for new papers. This is a growing field, and young researchers have ample scope to make substantial contributions. But those ideas, really suggestions, are harder to put on slides.
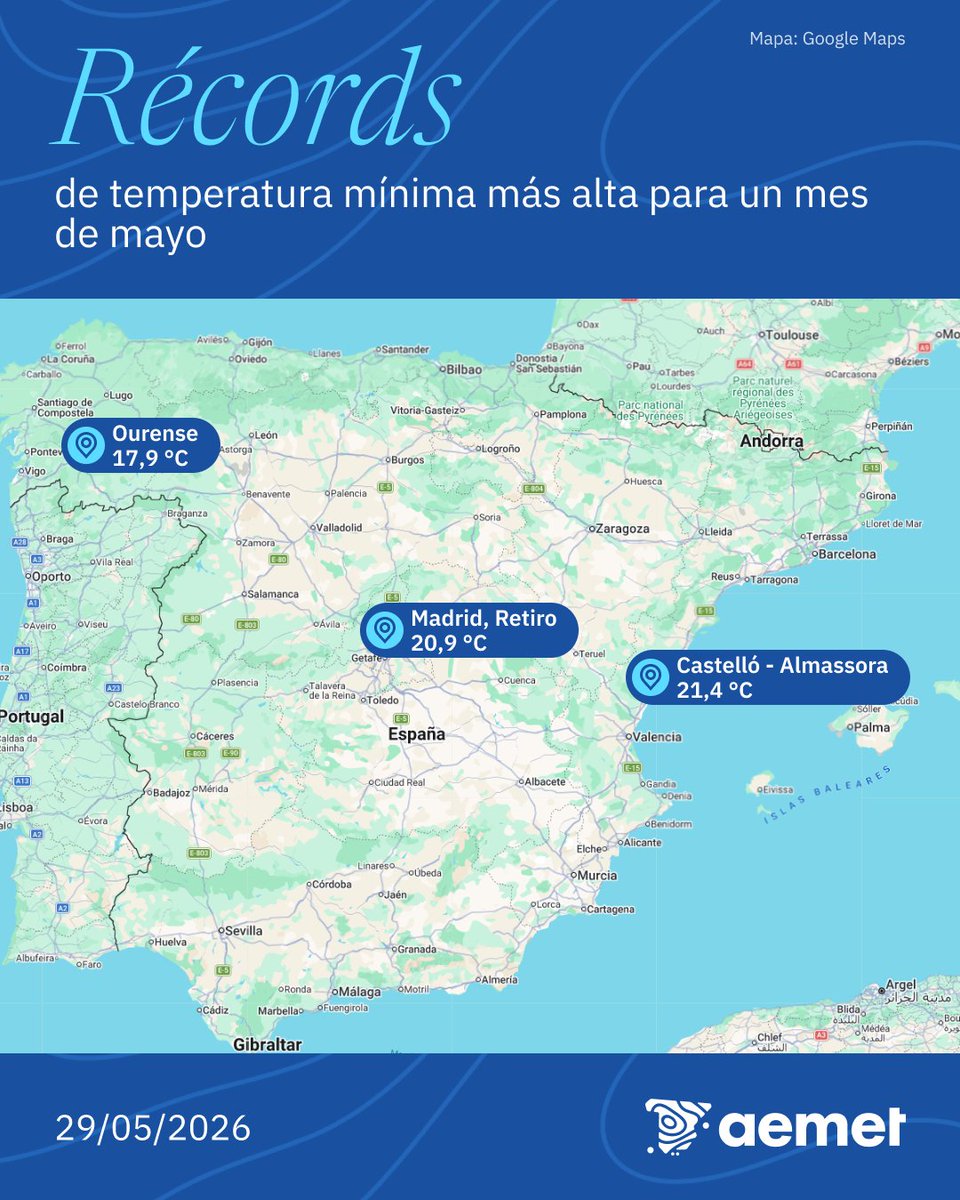
🌡️ 29 de mayo: récords de calor (máximas y mínimas) de mayo.
➡️ Huesca aeropuerto batió ambos récords en una serie de 83 años.
➡️ Navacerrada superó en 1 °C su récord anterior (80 años de serie)
➡️ La noche más cálida en Madrid-Retiro en mayo desde, al menos, 1920.
1/2
I just finished teaching the first lecture of the course “Geoeconomics Uncovered: Theory Meets Evidence” at Oxford, so I decided to post the slide deck:
https://t.co/8lcVCInfi4
This was a 90-minute, big-picture lecture: what is geoeconomics, why does it matter, and what can economists do in this field?
It draws on several plenary talks I have given over the past year, so you may have seen some of these slides before. But I have many new followers, and some are clearer than before.
During the rest of the week, I will post more of these slide decks. The next one will be on the history of the field.
PS: Oxford is such a lovely place. Unfortunately, a country that gave us Newton, Darwin, and Turing cannot keep escalators running at Heathrow.
A just-published paper introduces a new metric: the ratio of births observed (Bo) to births needed (Bn) to make up for deaths.
When Bo/Bn is below 1, a population faces natural decline.
With this lens, the dire situation of Europe and East Asia is thrown into stark relief. 🧵.
Last Friday, I posted about Spain's economic performance since 1277. I chose that starting point because by then the Reconquest of the Iberian Peninsula was largely complete. After 1277, only a rump Muslim state, the Emirate of Granada, remained, surviving until 1492 (a fact often overlooked outside Spain).
What do we know about the economic performance of Muslim Iberia?
In a paper forthcoming in the Economic History Review, “The Golden Age of Al-Andalus? Living standards in Muslim Iberia (950–1200),” António Henriques attempts to answer this quantitatively, reconstructing real wages and welfare ratios.
Henriques finds that living standards in tenth-century Al-Andalus were high, in both absolute and comparative terms, comparable to those in Fatimid Egypt and the poorer parts of Europe before the nineteenth century. But by 1200, real wages had declined, particularly for skilled labor. This might explain why Muslim Iberia found it much harder to resist the advancing Christian kingdoms, and why most of it collapsed after 1212.
Link is here:
https://t.co/D7GyFjFGEK
In “Cohort Fertility & Couple Educational Pairing,” L. Andersson @MarikaJalovaara et al. show for the 1st time that the majority of births occur in homogamous or hypogamous unions & in those w/ a tertiary-educated partner. @SOFI_su_se https://t.co/8JzAzy44qK
⚠️ España es el país de la OCDE con más desigualdad entre la educación pública y concertada.
Tiene la mayor diferencia socioeconómica entre los alumnos de la escuela concertada y pública.
¿Lo sabías? Te leemos👇
📊Un gráfico de @jaramonter
https://t.co/ejSTuMJTpp
Our paper “Difference-in-Differences Designs: A Practitioner’s Guide” is now published in the Journal of Economic Literature. It took us a while but we are happy!
We put together a lot of material to make the paper useful in practice: https://t.co/30TbAgihlz
Hope you like!
Las relaciones profesor-alumno no solo influyen en el clima del aula. Un meta-análisis de 26 meta-análisis muestra efectos consistentes sobre rendimiento, emociones académicas, autocontrol, motivación y bienestar estudiantil. La calidad de la relación importa para muchos resultados educativos. meta-análisis en Psychological Bulletin @Fundacion_SM https://t.co/VgNwskYuiT https://t.co/pIP5E7VlR2
How has the Spanish economy performed over the very long run?
To answer, I use Leandro Prados de la Escosura’s (@LdelaEscosura) data on real GDP per capita from 1277 to 2024. I express Spain’s figure as a ratio to Britain’s, since Britain was the first economy to achieve modern economic growth, from around 1660, and has been the leader, or close to it, ever since.
Spain, within its present borders, was prosperous in the Late Middle Ages, well ahead of Britain, then a peripheral corner of Europe. The Black Death and its aftermath hit Spain harder, and by 1360, the two economies had converged.
That parity held until 1600, when Spain began a long decline, in absolute terms (on the eve of the French Revolution, it was barely above its 1600 level, after a deep slump in between) and in relative terms (Britain pulled steadily away). The standard explanations, the Habsburg wars, and the serial bankruptcies run into one problem. They can account for the poor performance between 1550 and 1650, but not for the stagnation between 1650 and 1789. 140 years of stagnation is far more than wars and debt under the Habsburgs can explain.
The series also shows that Spain did not benefit from its empire. That is a problem for every theory tying colonies to modern growth. At most, one can argue that colonies were a necessary condition for takeoff (I do not believe even that, but leave it for another day). One cannot argue that they were sufficient.
The period from 1789 to 1936 was no kinder. The economy grew a little, and Spain built a modern but unfinished liberal state. Yet it never closed the distance to Britain. It is hard not to read the period from 1789 to 1936 as a national failure and the Civil War as its final consequence.
The recent efforts of some historians to paint those years in brighter colors strike me as unfounded. Spain did not fail at modernization as badly as China, but it did not succeed. A deeply corrupt dynasty, closed and incompetent elites in Madrid, Barcelona, and Bilbao, and an economic policy built on intervention and protection (by 1920, Spain was the most protectionist economy in the Western world, so much for the friends of protection) together made the country a basket case.
A cruel civil war left Spain at its historical low, with just 31% of the British GDP per capita. The foreign visitors who arrived in the early 1950s found a poor, backward country.
Policy in the first twenty years of the dictatorship was awful. Autarky was not so much imposed by the Allies as chosen. Spain’s rulers, using their quasi-fascist Weltanschauung, believed growth would come from state intervention, closed markets, and unorthodox fiscal and monetary policy.
Then, in 1959, policy changed. Spain adopted a more orthodox fiscal and monetary policy and opened to foreign investment and trade. The results were spectacular. For forty years, Spain grew briskly and became the modern country it is today. By 2001, it had reached 77% of British GDP per head.
But the internal contradictions of two things eventually became binding: the growth model launched in 1959, and the political regime created by the 1978 constitution. By 2024, Spain had slipped back to 74% of British GDP per head. This is worse than it looks. Britain itself has done poorly over the past twenty years, and losing ground to a weak performer is a bad sign.
Spain stands at a crossroads, economic and political. The country’s foundations no longer work, but its political and business elites have failed to understand this fundamental reality. A good grasp of its economic history helps make sense of its present predicament.