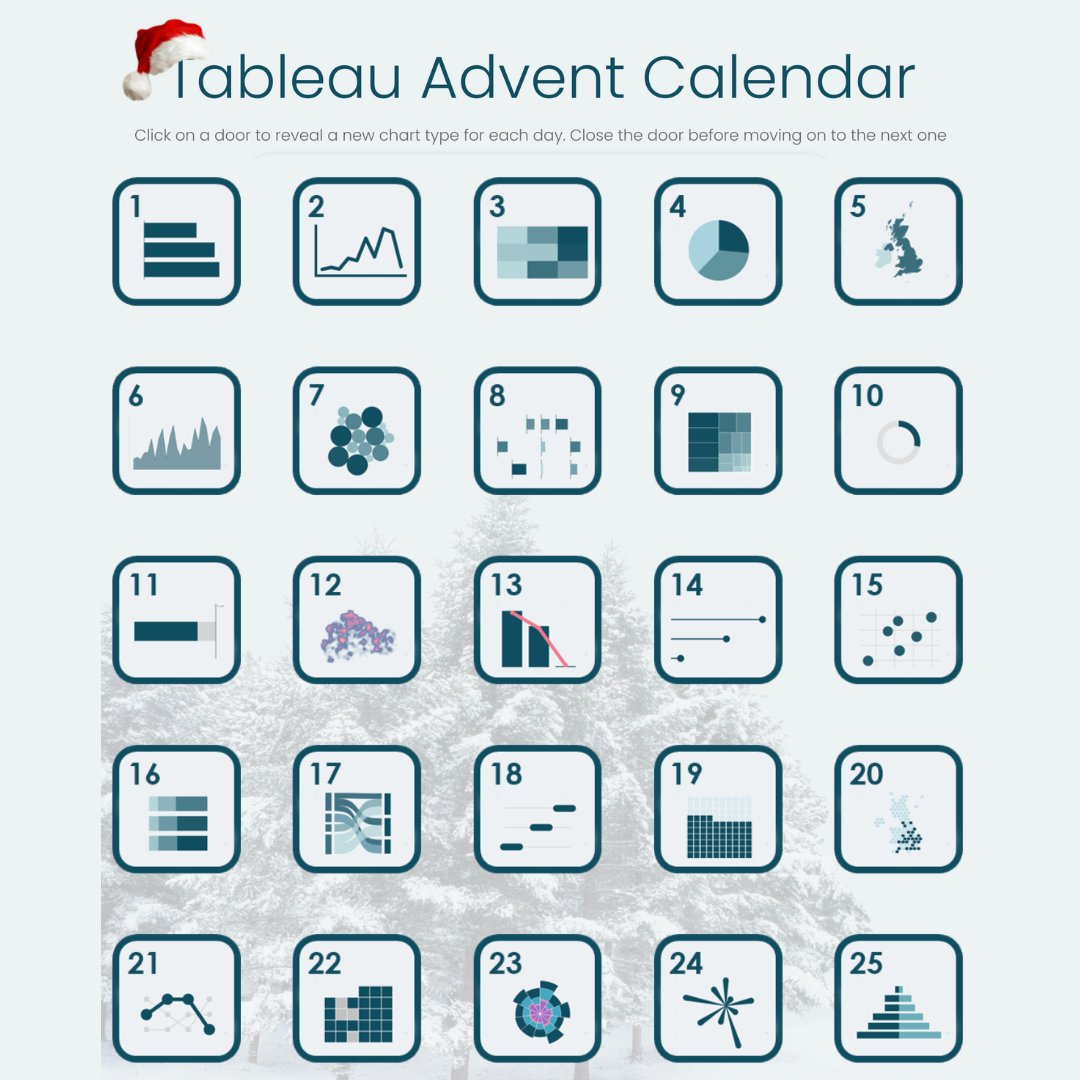
Discover a new chart type each day with this #VizOfTheDay by @data_and_stuff.
Countdown to the holidays with this interactive advent calendar viz. https://t.co/mjWHjPWQD0
🚨 NEW #IronQuest Recap | Advanced Charts 🚨
https://t.co/uALyshxWxn
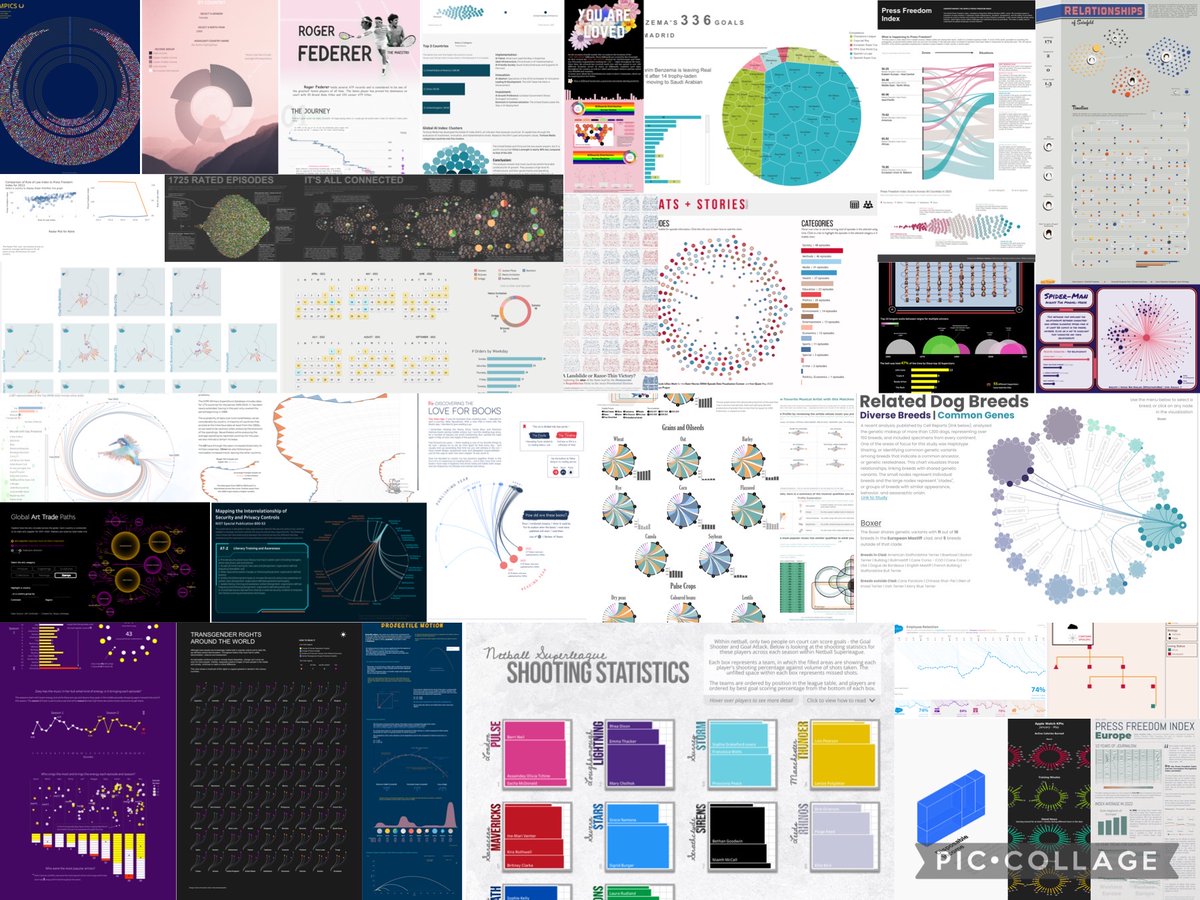
Thank you to everyone who entered the last round of #IronQuest! We received a record number of #VizOfTheDay awards for this round, plus our highest number of entries for any round since 2021! 🎉
Check out all of the entries in the recap post! 🤩
#datafam #tableau #dataviz
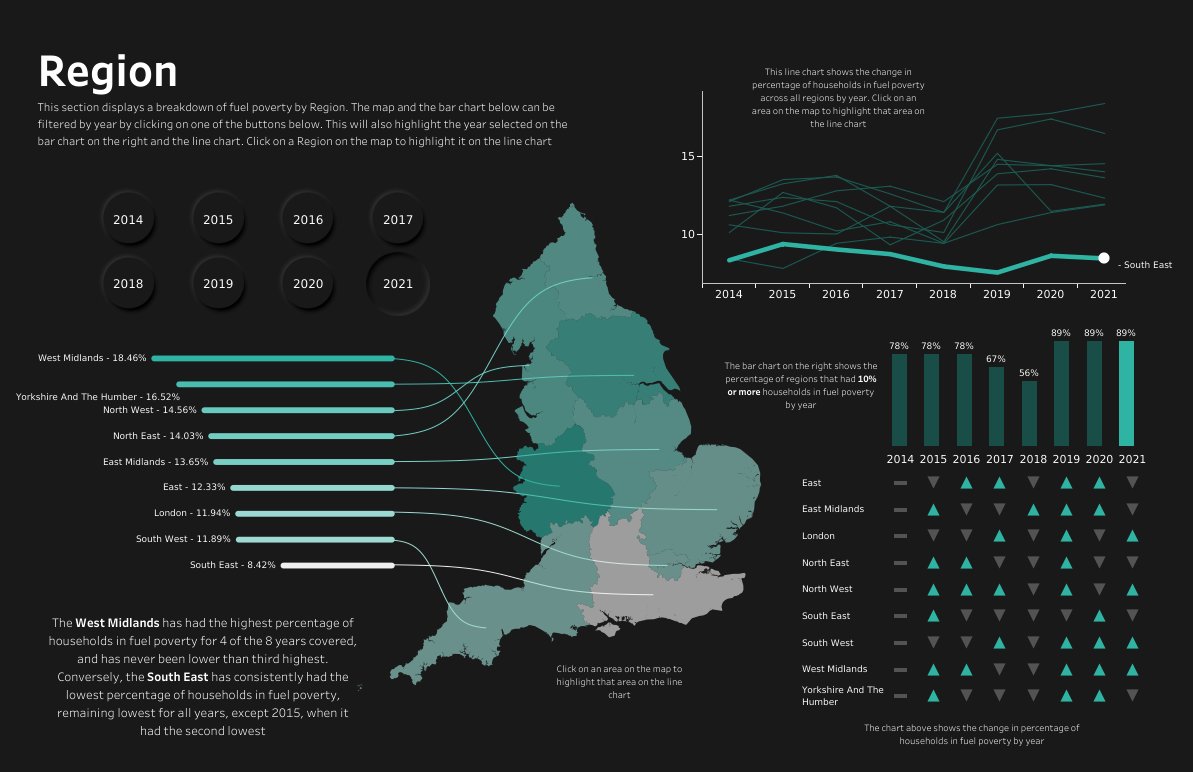
Fuel poverty is the inability to afford to keep one's home adequately heated. Explore this #VizOfTheDay by @data_and_stuff to learn more about the situation in England from 2014 to 2021. https://t.co/ZExBw0OI6L
It's been a minute but...
New viz time! After doing work for colleagues on #FuelPoverty in #Surrey, I took a wider look at the picture across #England.
This @tableau workbook allows you to view relative fuel poverty at different geographical levels:
https://t.co/wYJFMDkpsg
Join us on 16th March at 14:00 GMT for the first #PublicSector@tableau#UserGroup of 2023!
Tune in to hear #HampshirePolice and #SurreyCountyCouncil's data journeys!
We're still looking for another speaker - if you're interested please reach out!
https://t.co/f6gm4Yn1ce
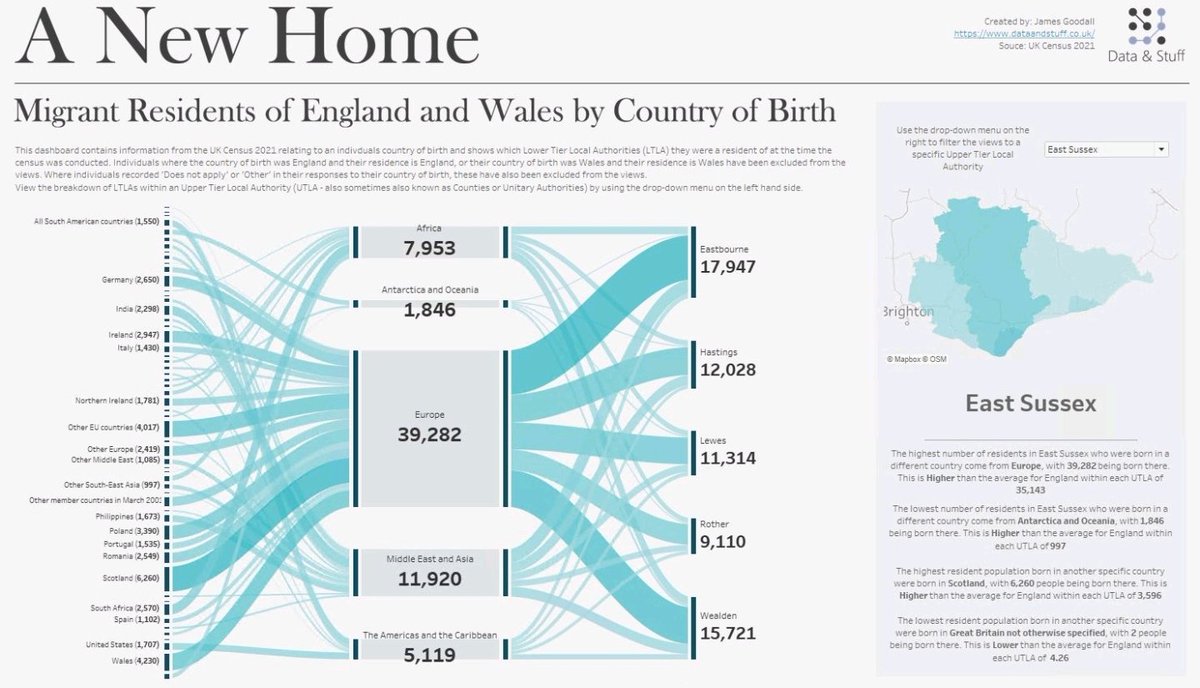
It's been a while since I came on here, but with the latest release of #Census2021 data, I thought I'd try and dust off the cobwebs.
Interactive @tableau workbook here -> https://t.co/y2tXFzUdXp
#tableau#data#datanalytics#viz#dataviz
This Wednesday (6th April) - tune in the the @tableau#PublicSector summit! Featuring some great presentations from #NHS, #WorldEconomicForum & #UnitedNations - this one will definitely be interesting!
Sign up here 👇👇
https://t.co/TT7FcOrIyA
Gold Winner for Best Use of Data Insight is @SurreyCouncil for its Data Insight programme. 🎉👏 This award recognises the use of data insight and the application of data, rewarding creative approaches to managing and manipulating data to deliver outstanding results.