Day-7
#40daysofdataanalytics,#66daysofdata,#100daysofcode-
- Passed an 'EDA with SQL' assessment
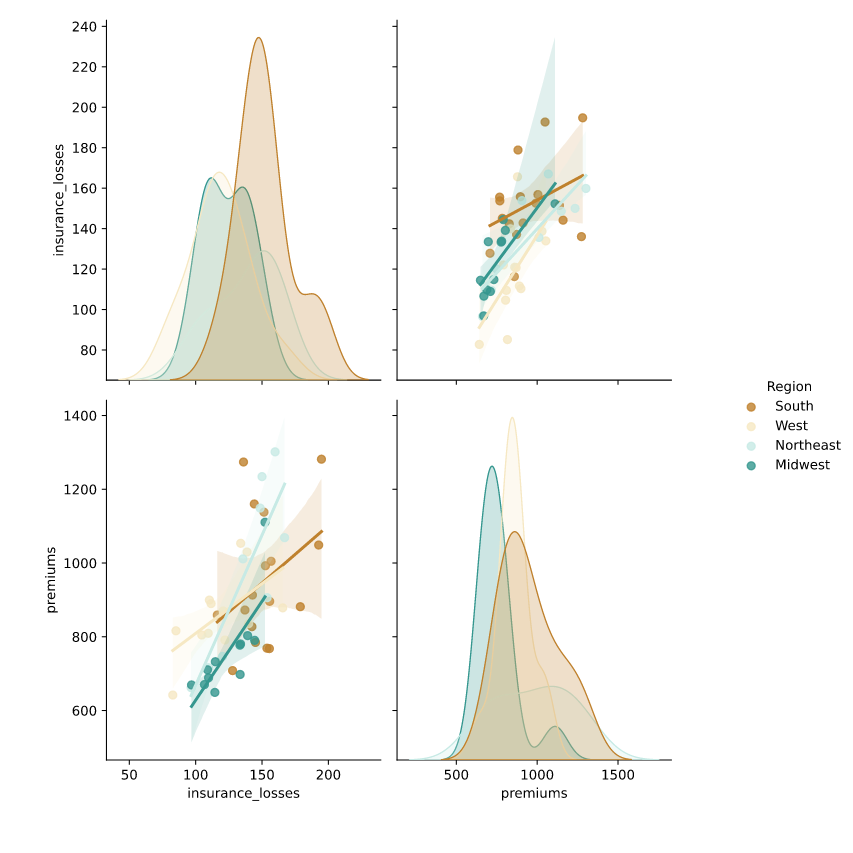
-Learned about the pair plots and FacetGrid
- this is the image of a pair plot drawn using seaborn
-realised that its really important to remember the password for MySQL db connection
Day-5
#40daysofdataanalytics,#66daysofdata,#100daysofcode-
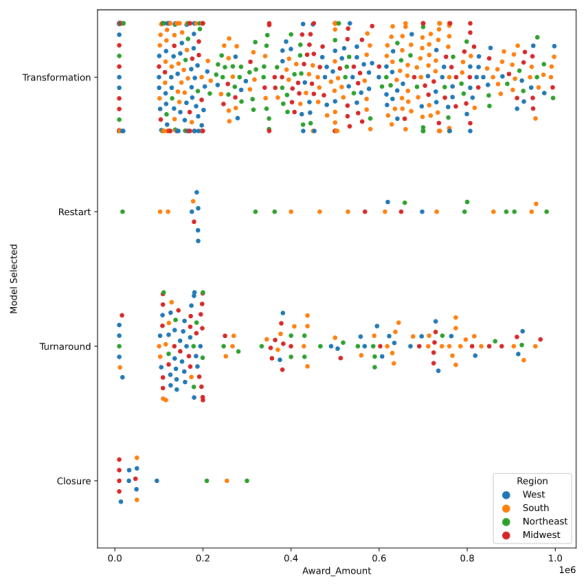
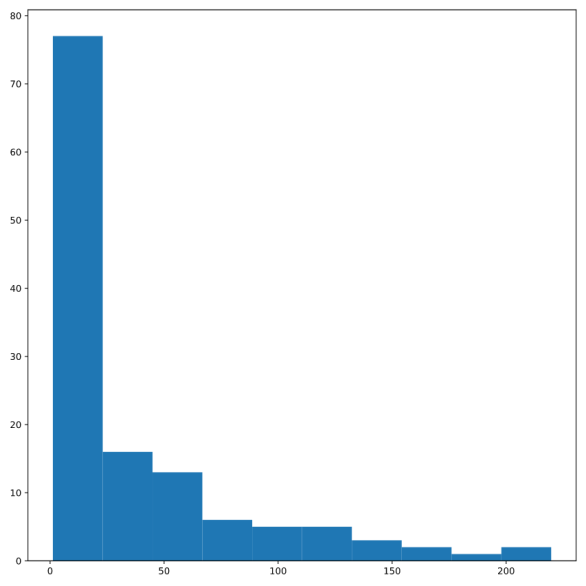
- Learned different types of plots in seaborn and matplotlib
-learned about correlation in data using pandas
-this is the image of a swarm plot
Day-4
#40daysofdataanalytics,#66daysofdata,#100daysofcode-
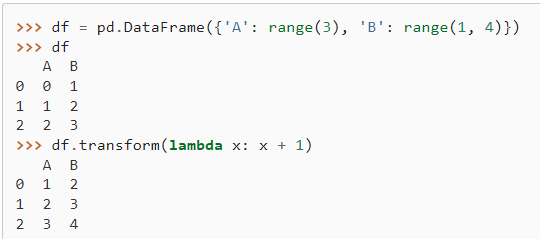
-learned the use of indexing in subsetting and sorting data frames using pandas
- I found this way , easier and better but the cons are that the data frame changes by putting the columns as indexes
Day-29
#40daysofdataanalytics,#66daysofdata-
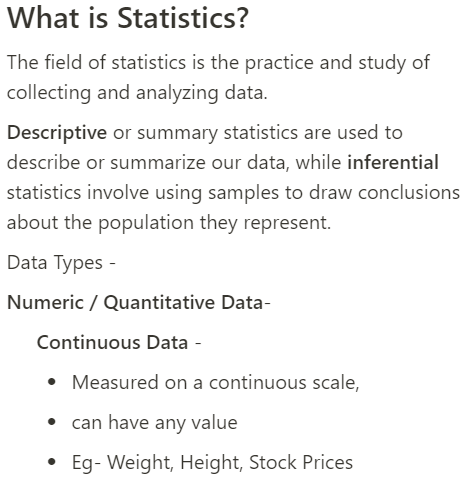
-Data analysis and Visualisations in Excel
-Found that we can change data in a picture to an excel sheet but the feature is limited to the android version I guess
#100DaysOfCode -
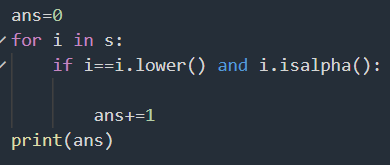
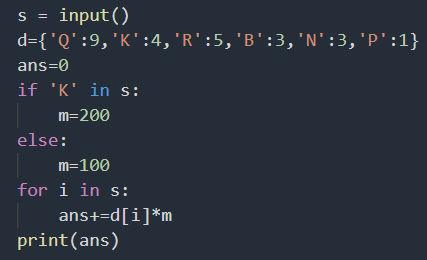
-Solved a #python problem on #Clashofcode
Thread⏬