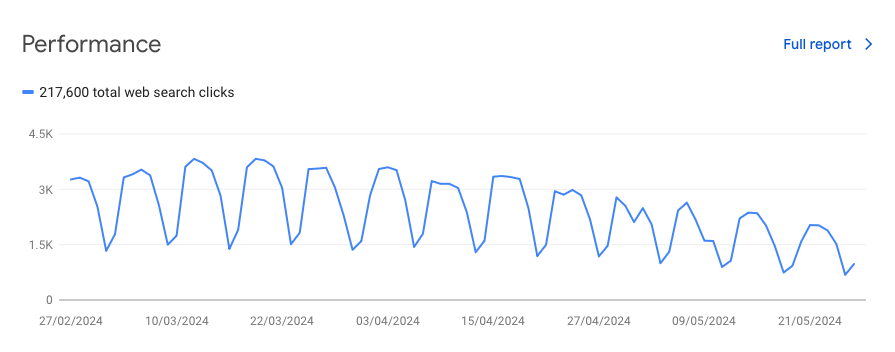
😢 Any SEO experts around here?
Google is suddenly killing my https://t.co/fGXOmTrVVy, after years of good feedback from the python community..
I'm currently working hard on it with @joseph_barbier.
Updating & adding 100% human content.
I have NO idea what to do!
Did you know many nations have sharply declining fossil fuel emissions?
22 fossil fuel timeseries for #30DayChartChallenge, total and per-capita Fossil CO2 emissions for countries and regions
👉https://t.co/FzwNTBVeZ2
#d3js#rstats#scrollama
Beta testers wanted! I'm looking for #SurveyCTO and #Rstats users to test out a software package that I wrote. Would love to know whether it works for you and what features should come next. Holler back. Thanks! https://t.co/WyonFK7s8u
Not on purpose but I kinda like it...
Ridgeline plots with #ggdist for the @tazgezwitscher lab 2024 tomorrow, using the wonderful @zeitonline article on East-West migration as a showcase example.
Made in #rstats with #ggplot2.
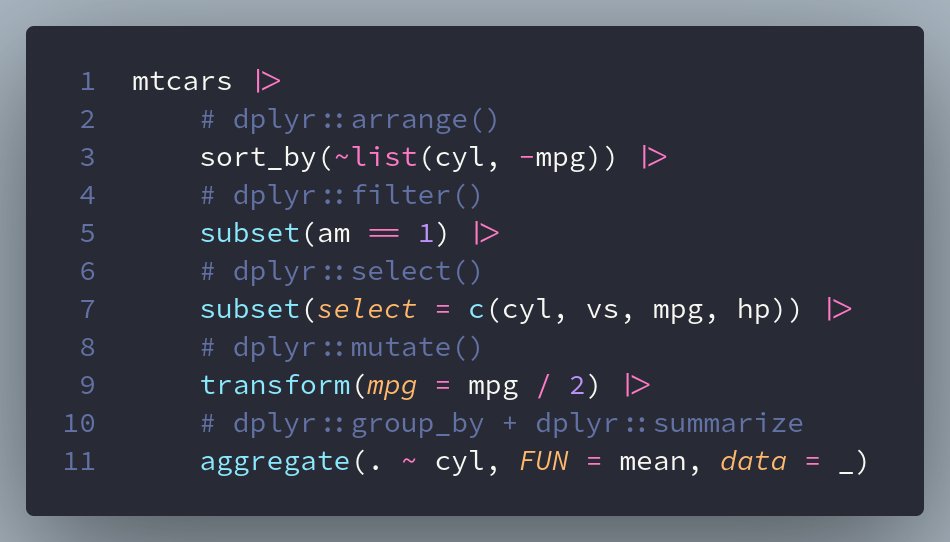
Inspired by a post shared by @cararthompson, this example is a good reminder that there are always multiple solutions for any one #rstats problem.🌟
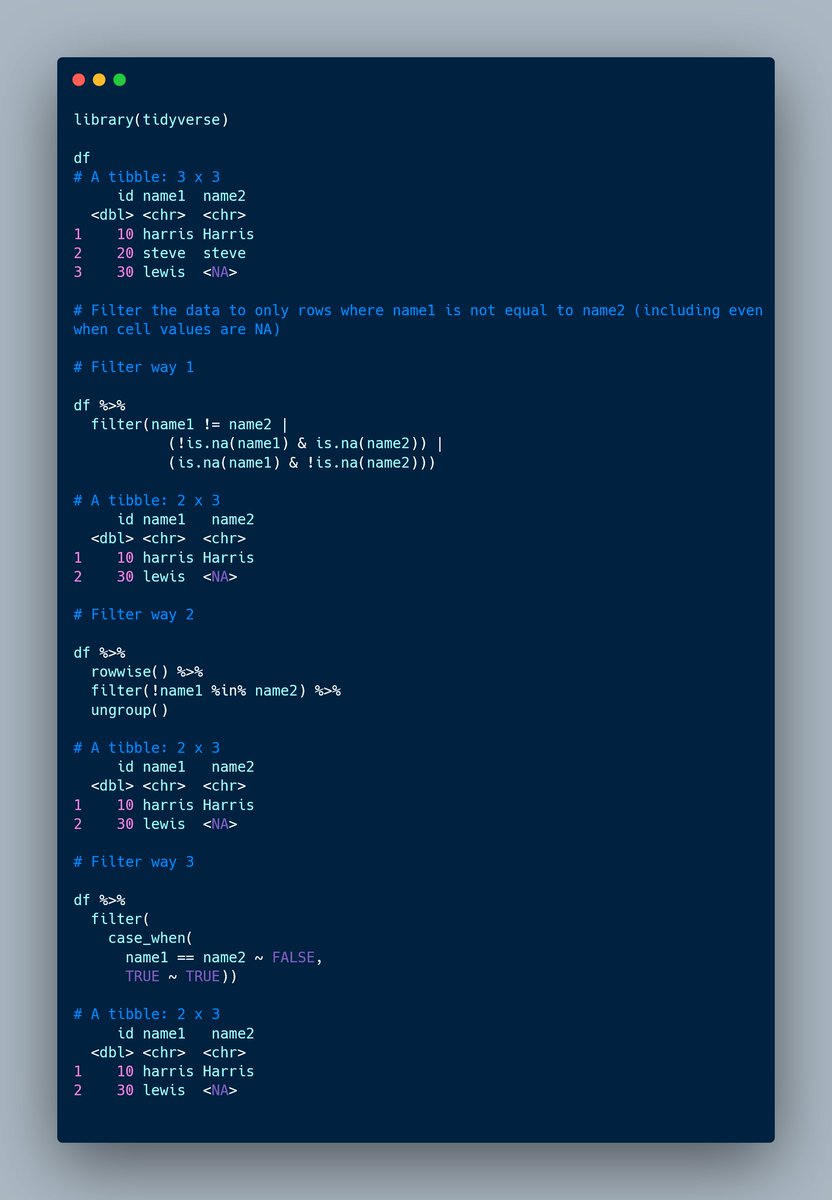
If you are curious about how dplyr::filter() evaluates NAs, you can read more here: https://t.co/bcp8WVFjqy
🌃✨ Witness the decade-long transformation of South Asia's night lights with my latest swipe map, powered by EOG's VIIRS data. It's a striking look at how our world changes after dark. Learn to create your own with my R tutorial: https://t.co/JN0uBCHqtH
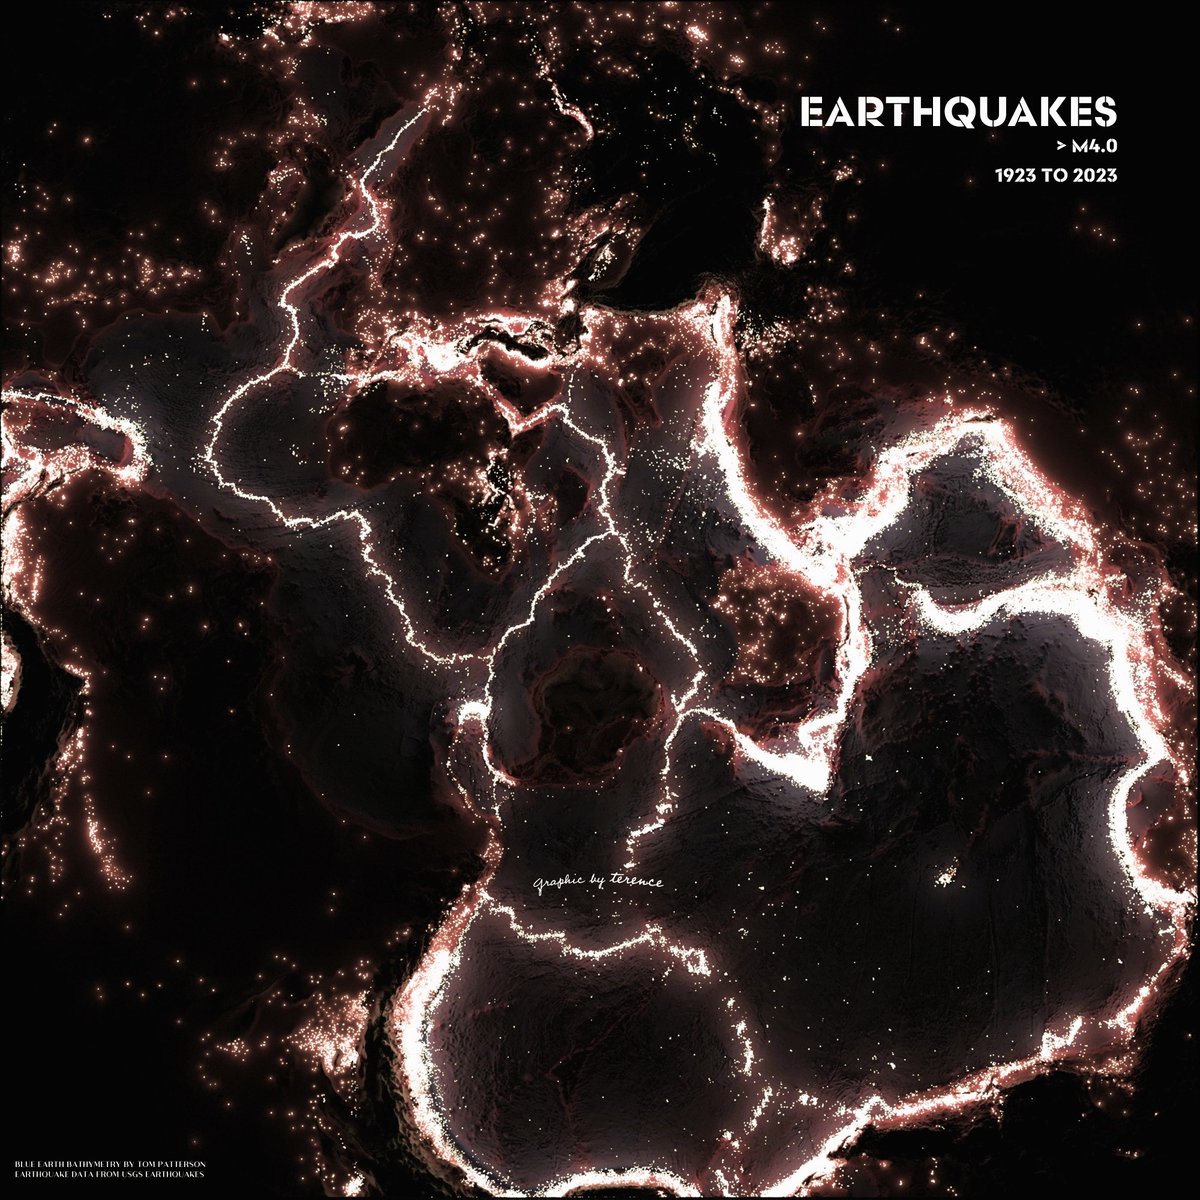
Can't seem to stop so here's earthquakes (> M4.0) of the world, 1923 to 2023. I like how we can see the plates and active fault lines in a compact way.
Have a couple more before I move on so bear with me. 😅
#rayshader adventures, an #rstats tale
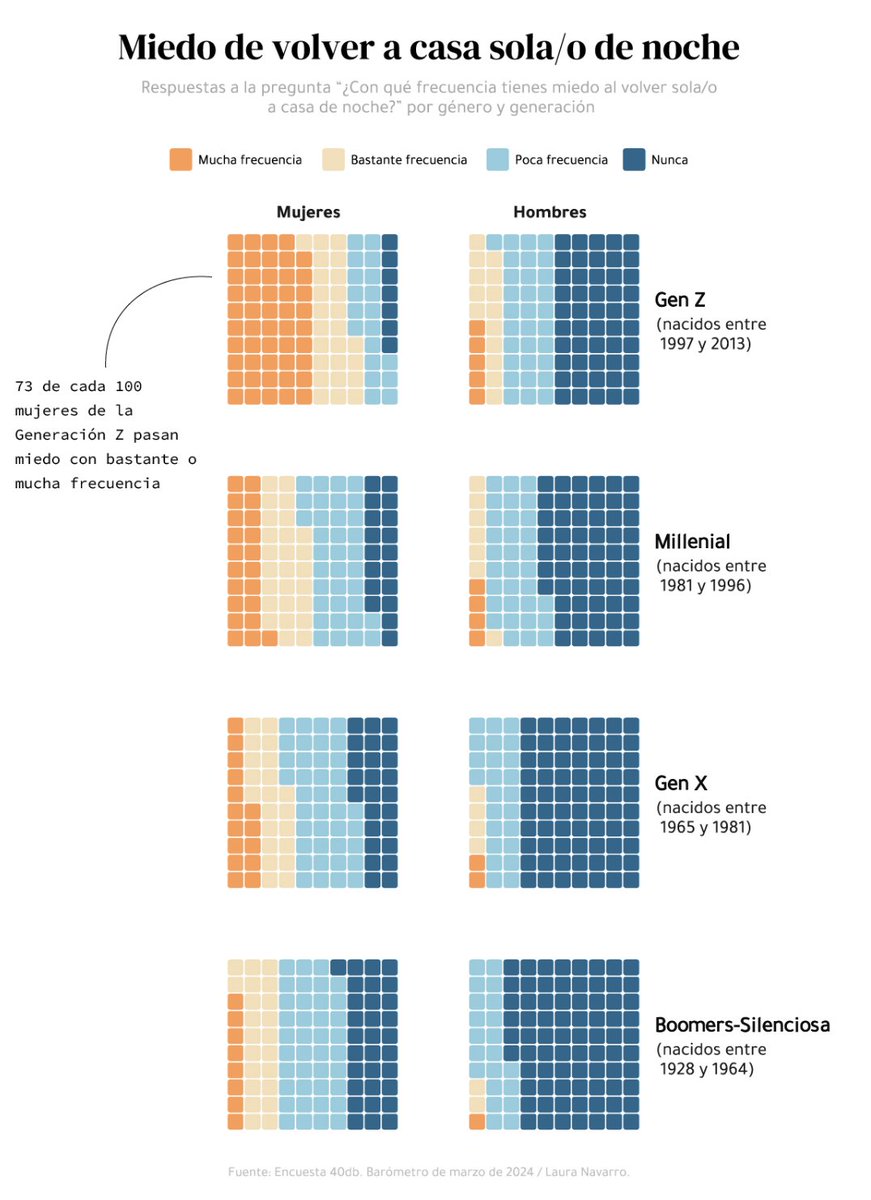
I recently discovered the work of @LauraNavarroSol
She's a visual journalist for El Pais.
What she creates is amazing!! ❤️
You should follow her if you're interested in #dataviz and #rstats
https://t.co/JYVvfWF6v0