🧩 [TIP] – Visualizá flujos de orígen-destino en mapas con {flowmapblue}
¿Querés mostrar cómo se mueven personas, bienes o información entre lugares? Con {flowmapblue} podés crear mapas interactivos que representan flujos de un origen a un destino.
✔️ Mostrá conexiones entre ciudades, regiones o países.
✔️ Generá visualizaciones atractivas directamente desde R.
✔️ Ideal para proyectos de transporte, migración, comercio o movilidad urbana.
💡Este tipo de mapas es clave cuando el objetivo es entender direcciones y volúmenes de movimiento, más allá de la geografía estática.
🔗 https://t.co/MEsrhMAOm3
✍️ Ilya Boyandin
#RStats #Rtips #DataViz #flowmapblue
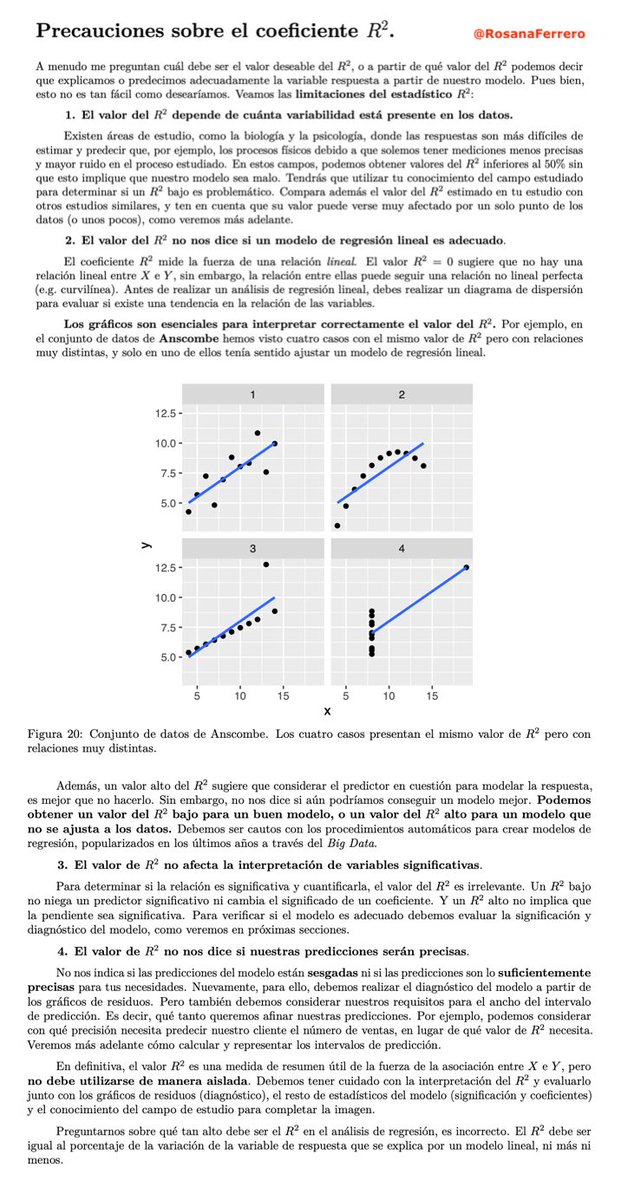
🔥 El R² no es el indicador que crees 😲
💥 ¿Piensas que un R² alto significa que tu modelo es bueno?
💥 ¿Crees que puedes compararlo entre modelos sin problema?
💥 ¿Usas el R² como la única métrica para evaluar el ajuste?
😱 ERROR 😱
14 VERDADES INCÓMODAS sobre R² 🧵👇
🚀 New version of the rgnoisefilt package! Tailored for tackling noise problems in regression. Dive into the latest features on GitHub: https://t.co/TlWsTyJNw4…
📊🛠️ #rstats#Rprogramming#DataScience#OpenSource
https://t.co/17cDlgTDY3
[PAQUETE 📦] - 🎨 {ggiraph}: Gráficos interactivos en R, ¡más fáciles que nunca! ✨📊
Con {ggiraph}, lleva tus visualizaciones al siguiente nivel añadiendo interactividad directamente a gráficos creados con ggplot2. Este paquete es perfecto para transformar gráficos estáticos en herramientas dinámicas y atractivas.
✨ Características destacadas:
🖱️ Añade interactividad a gráficos con hover, clics y enlaces.
🔧 Compatible con ggplot2 y fácil de integrar en tus flujos de trabajo.
🌐 Exporta gráficos interactivos para la web o presentaciones.
Ideal para analistas, científicos de datos y cualquier persona que quiera hacer sus gráficos más atractivos y útiles.
📍 Descubre más aquí: ggiraph en su sitio web
¡Haz que tus visualizaciones brillen con {ggiraph}! ✨🚀
🌐 https://t.co/hJzsAyT60t
✍🏼 @DavidGohel
#RStats #RStatsES #Rtips #DataScience
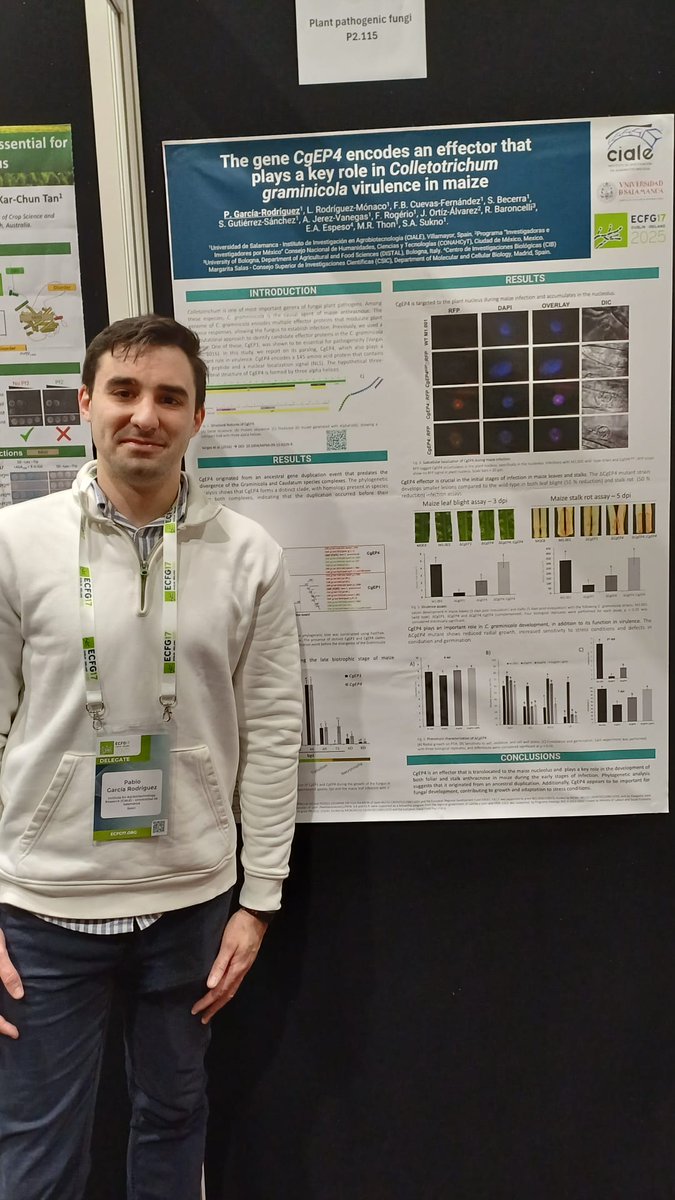
Today it's time for our collaboration with Pablo Garcia Rodriguez @usal. He presents his work in which the effector CgEP4 plays an important role in the development of maize anthracnose by translocating into the nucleus and nucleolus. Led by @ssukno and M. Thon #ECFG17
The #Colletotrichum Workshop at the #ECFG17 started today with Dr. Michael Thon from the Univ. of Salamanca, Spain presenting : Unraveling the evolutionary history of genetically diverged lineages of Colletotrichum graminicola. You still have a chance to see his poster.
Pablo Garcia Rodriguez from the University of Salamanca presenting his results on
The gene CgEP4 that encodes an #effector that plays a key role in #Colletotrichum graminicola virulence in maize and translocate to its nucleus
at the #ECFG17, #ecfg17, Stop by his poster!
📌Seminario de Investigación "Genómica comparativa y reordenamientos estructurales en el patógeno de la antractnosis del maíz Colletotrichum graminicola".
📆Viernes, 24 de mayo
🕧12:30 horas
📍Salón de Actos @CIALE_USAL + virtual
👩🔬 Sioly Becerra
💻Acceso remoto: https://t.co/VW40IMfceX
[PAQUETE 📦] - ¿Trabajas con info de tráfico?
Con {googletraffic} vas poder armar data georreferenciada a partir de la información de tráfico de Google Maps en tiempo real.
🌐 https://t.co/acI7a5ZVnV
✍🏼 @robamarty@WorldBank#RStats#RStatsES#Rtips#DataScience
¿Quieres visibilizar tu institución o empresa? ¿Quieres dejar tu impronta en el III Congreso de R?
¡Buscamos interesado/as en patrocinar el evento!
Consulta las bases en el enlace: https://t.co/U0T2rvKVoG
Más información: [email protected]#RTieneUnColorEspecial#3RqueR
[FUNCION ⚒️] - ¿Tablas adentro de un gráfico? Claro que si! Proba con la función geom_table() del 📦 {ggpp} y asombrate de los resultados!
🌐 https://t.co/VCbNZuhIBF
✍🏼 gh/aphalo
#RStats#RStatsES#Rtips#DataScience
Our new #Paper is out!
In this paper, we studied the funcional evolution of the of P450 family enzymes belonging to the plant-pathogen Colletotrichum Spp
#Evolution#Colletotrichum#P450. Check out the full paper in the following link:
https://t.co/ZocYvBUGKM
😰Lidiar con la limpieza de datos puede ser tedioso, pero con 📦 janitor de #RStats se vuelve mucho más fácil
Limpia los nombres de variables, elimina filas y columnas vacías o constantes, identifica duplicados, crea tablas de frecuencia y proporciones.
https://t.co/9n16d2VwFD


![estacion_erre's tweet photo. 🧩 [TIP] – Visualizá flujos de orígen-destino en mapas con {flowmapblue}
¿Querés mostrar cómo se mueven personas, bienes o información entre lugares? Con {flowmapblue} podés crear mapas interactivos que representan flujos de un origen a un destino.
✔️ Mostrá conexiones entre ciudades, regiones o países.
✔️ Generá visualizaciones atractivas directamente desde R.
✔️ Ideal para proyectos de transporte, migración, comercio o movilidad urbana.
💡Este tipo de mapas es clave cuando el objetivo es entender direcciones y volúmenes de movimiento, más allá de la geografía estática.
🔗 https://t.co/MEsrhMAOm3
✍️ Ilya Boyandin
#RStats #Rtips #DataViz #flowmapblue](https://pbs.twimg.com/media/G1h0aXQXsAAL3jr.jpg)


![estacion_erre's tweet photo. [PAQUETE 📦] - 🎨 {ggiraph}: Gráficos interactivos en R, ¡más fáciles que nunca! ✨📊
Con {ggiraph}, lleva tus visualizaciones al siguiente nivel añadiendo interactividad directamente a gráficos creados con ggplot2. Este paquete es perfecto para transformar gráficos estáticos en herramientas dinámicas y atractivas.
✨ Características destacadas:
🖱️ Añade interactividad a gráficos con hover, clics y enlaces.
🔧 Compatible con ggplot2 y fácil de integrar en tus flujos de trabajo.
🌐 Exporta gráficos interactivos para la web o presentaciones.
Ideal para analistas, científicos de datos y cualquier persona que quiera hacer sus gráficos más atractivos y útiles.
📍 Descubre más aquí: ggiraph en su sitio web
¡Haz que tus visualizaciones brillen con {ggiraph}! ✨🚀
🌐 https://t.co/hJzsAyT60t
✍🏼 @DavidGohel
#RStats #RStatsES #Rtips #DataScience](https://pbs.twimg.com/media/GpJ1l7eXUAAtgic.jpg)



![estacion_erre's tweet photo. [PAQUETE 📦] - ¿Trabajas con info de tráfico?
Con {googletraffic} vas poder armar data georreferenciada a partir de la información de tráfico de Google Maps en tiempo real.
🌐 https://t.co/acI7a5ZVnV
✍🏼 @robamarty @WorldBank
#RStats #RStatsES #Rtips #DataScience https://t.co/1j6kYP52cZ](https://pbs.twimg.com/media/GMqWwlYXEAAA4zf.jpg)
![estacion_erre's tweet photo. [PAQUETE 📦] - ¿Trabajas con info de tráfico?
Con {googletraffic} vas poder armar data georreferenciada a partir de la información de tráfico de Google Maps en tiempo real.
🌐 https://t.co/acI7a5ZVnV
✍🏼 @robamarty @WorldBank
#RStats #RStatsES #Rtips #DataScience https://t.co/1j6kYP52cZ](https://pbs.twimg.com/media/GMqWwlXXgAAfy25.jpg)





![estacion_erre's tweet photo. [PAQUETE 📦] - 🎨 {ggiraph}: Gráficos interactivos en R, ¡más fáciles que nunca! ✨📊
Con {ggiraph}, lleva tus visualizaciones al siguiente nivel añadiendo interactividad directamente a gráficos creados con ggplot2. Este paquete es perfecto para transformar gráficos estáticos en herramientas dinámicas y atractivas.
✨ Características destacadas:
🖱️ Añade interactividad a gráficos con hover, clics y enlaces.
🔧 Compatible con ggplot2 y fácil de integrar en tus flujos de trabajo.
🌐 Exporta gráficos interactivos para la web o presentaciones.
Ideal para analistas, científicos de datos y cualquier persona que quiera hacer sus gráficos más atractivos y útiles.
📍 Descubre más aquí: ggiraph en su sitio web
¡Haz que tus visualizaciones brillen con {ggiraph}! ✨🚀
🌐 https://t.co/hJzsAyT60t
✍🏼 @DavidGohel
#RStats #RStatsES #Rtips #DataScience](https://pbs.twimg.com/media/GpJ1l7uXMAAV2ZF.jpg)



![estacion_erre's tweet photo. [PAQUETE 📦] - ¿Trabajas con info de tráfico?
Con {googletraffic} vas poder armar data georreferenciada a partir de la información de tráfico de Google Maps en tiempo real.
🌐 https://t.co/acI7a5ZVnV
✍🏼 @robamarty @WorldBank
#RStats #RStatsES #Rtips #DataScience https://t.co/1j6kYP52cZ](https://pbs.twimg.com/media/GMqWwldW4AAFZKN.jpg)


![estacion_erre's tweet photo. [FUNCION ⚒️] - ¿Tablas adentro de un gráfico? Claro que si! Proba con la función geom_table() del 📦 {ggpp} y asombrate de los resultados!
🌐 https://t.co/VCbNZuhIBF
✍🏼 gh/aphalo
#RStats #RStatsES #Rtips #DataScience https://t.co/G20RRUkYjR](https://pbs.twimg.com/media/GEsgsChaMAA9TXM.jpg)