@shan_gsd @JSBaucke @MMarie@KerryKolosko @NerdyWithData The selectable timeline is a simple line chart with markers, the reference date in axis and a measure (close) in values. There are no relations between date table and stocks so the values are identical whatever the date ;-)
This week Challenge with #WOW2022 looking at how a metric has changed from the value at a specified reference date 👍 in #PowerBI
@JSBaucke, @MMarie, @shan_gsd, @KerryKolosko, @NerdyWithData
https://t.co/byZ9ODxgul
Happy New Year to all of BI addicts 🤪 and others 🥳
New Year, New Challenge with #WOW2022
This first week challenge is about the new released feature, Sparklines 👍 in #PowerBI
@JSBaucke, @MMarie, @shan_gsd, @KerryKolosko, @NerdyWithData
https://t.co/8pyQOrovO6
La BI au service du #sport ! Découvrez dans ces rapports comment #PowerBI permet d'analyser les données issues des matchs du championnat de basket féminin (#lf2), et comparer les performances des joueuses match après match, dans l'…https://t.co/oJkBMDXMVs https://t.co/5QzRcmvfLe
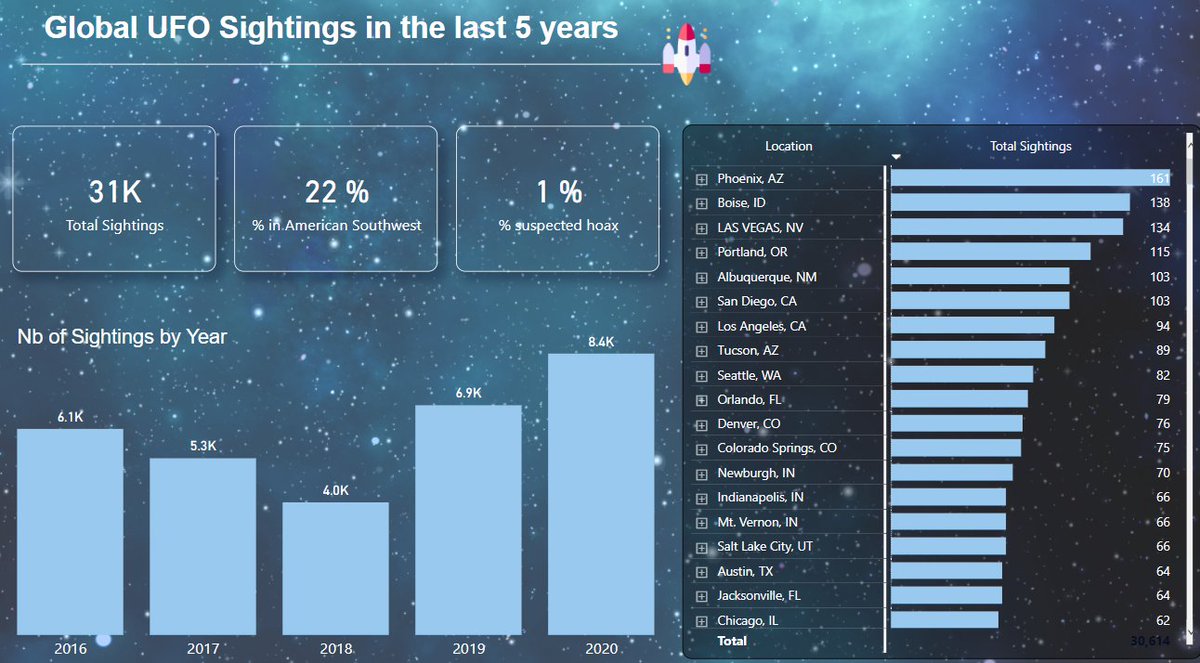
Classical Drill Down to the UFO sightings with #PowerBi. Thanks to #wow2021 week 5 for this amazing dataset.
@JSBaucke, @MMarie, @shan_gsd, @dataveld
https://t.co/KV0cn09akJ
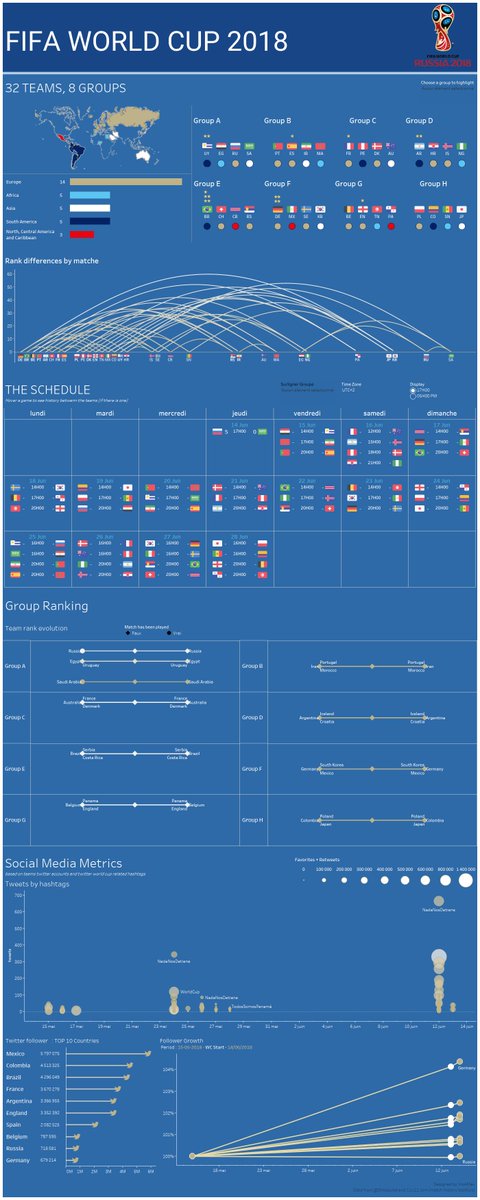
Glad to present my #Tableau#FifaWorldCup2018 Viz, using data provided by @OktoPulse
https://t.co/gGpczKYGHw
This is first version of the dashboard, I will try to update it every 1- 2 days to see the evolutions of scores, rankings and social media data :)