Bitcoin is now hovering at the exact level where EVERY bull trap ends.
Next week, another bearish rejection will send $BTC back to ~$53,000.
$60K → $53K → $47K → $87K → $151K
Next stops:
→ $53K next week
→ $47K by July
→ $151K by January
I called the recent Bitcoin dump publicly, $126k top in October 2025, and even $15k bottom in November 2022.
If you missed those calls, don't worry. I'll call the next one too.
Follow now. I'll call every major move.
What’s funny is that people labeled me a perma bear just because I was bearish for 8 months.
Now that I’ve flipped bullish after $BTC retraced from 126K to 59K, people seem surprised that I’m not like the other accounts on this app.
I’m here to make money, not defend a narrative. When the market changes, I change. I flip when necessary.
I guess some of you thought calling the top was just a fluke or a lucky guess. And when I catch the move to 160K, I’m sure some of you will call that luck too.
$BTC
Tomorrow is the 5th, which marks the pivot that has been workingfor the past 19 months.
Given that sentiment has become increasingly bearish heading into it, there's a possibility that we could see a bounce after the 5th.
If that turns out to be the case, I'd be watching the $68K–$69K region. However, the first step would be reclaiming the $65K range lows before any meaningful move higher can develop.
$BTC Showing Early Signs of Strength
While this is premature and DOESN'T suggest we bounce from here...
It is a healthy sign when you spot volume increasing vs perps.
I commonly refer to this as a "hidden" sign of strength.
IT MUST CONTINUE for any hope at seeing 70k again.
$BTC daily
*If* the previous swing low of $65K gives out, then look for a retest of the lows near $61K.
Why $61K? Isn't the bear flag target $50K or lower?
Because this is a break of an ascending channel, not a bear flag, and the difference is more than just semantics.
A bear flag is a shorter-term continuation pattern. They rarely retrace more than 38.2%, and they certainly do not continue to make new highs for 3+ months.
If this were a bear flag, the target would range from roughly $45K to $50K depending on how the flag is drawn and your preference for linear (45K) vs log (50K) charts.
An ascending channel, on the other hand, forms when real accumulation is taking place as indicated by the countless "bottom-is-in" signals that fired on the higher timeframes, and further supported by macro indicators turning higher such as ISM PMI and the copper/gold ratio breaking out.
When an ascending channel breaks out, up or down, the target is the breakout plus or minus the height of the channel.
The calls for $50K, $40K, even $30K will be deafening if we approach the lows, but the technicals do not support it.
The target for this ascending channel break, if met, would form a higher low near the weekly 200 SMA.
$BTC weekly
This is not the time to tune out, it is time to lock in.
2 weeks ago we looked at the possibility of a retest of the Hull Moving Average and today we got it.
Every one of these retests felt like death, but historically, this is the time to build your stack.
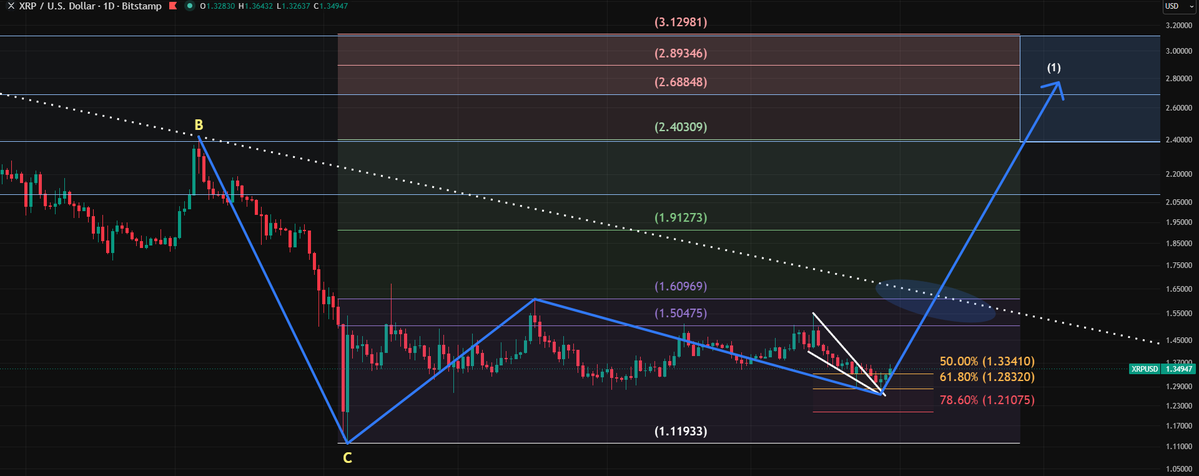
Once the 1.50–1.60 neckline resistance is broken...
A doubling is on the horizon #XRP
There will soon be a massive short squeeze across the board
The falling wedge is being respected. 61.8% bullish reversal.
🚀🚀🚀
$BTC (1W) - 74K is still holding… for now.
Last week, I pointed out that 74K was the key level bulls really didn’t want to lose.
BTC wicked below it this week, but so far buyers are still stepping in and pushing price back above support.
As long as BTC keeps reclaiming this area, this could still turn out to be the perfect retest.
We really don’t want to see weekly closes start happening below 74K.
The probability of a deeper retest toward the multi-month downtrend breakoutwould become very likely.
$FET/BTC is breaking out
RSI already broke out earlier from its multi-month downtrend.
Now the pair itself is trying to follow.
Momentum is building fast, but the important level now is R.
That’s the level I want to see reclaimed and held against BTC.
If that happens, this starts looking very similar to the early phase of previous expansion waves.
Bitcoin first target: 97K.
Second target: 144K.
$BTC There may be wicks on the futures side, but the main structure will most likely play out like this.
Bookmark this and wait.
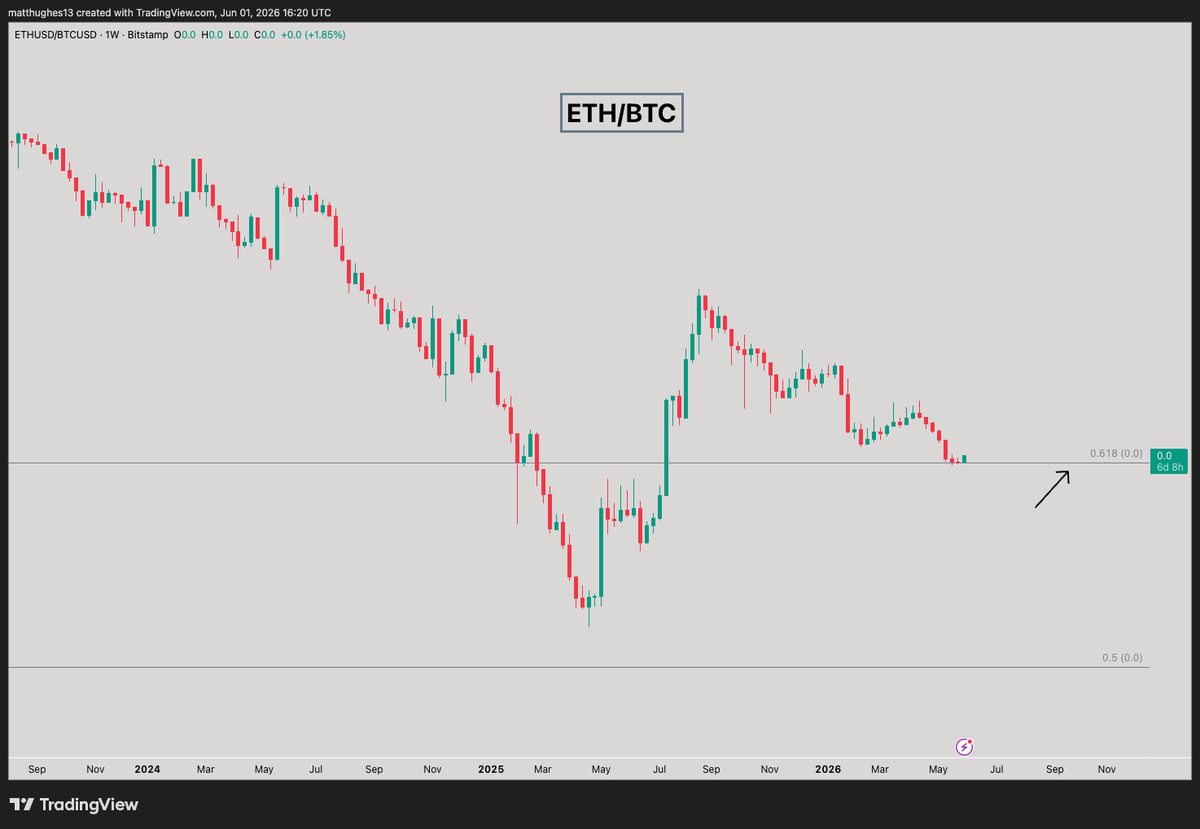
$ETH/BTC (1M) - ETH is getting squeezed hard here.
For years, ETH/BTC has been stuck inside this massive downtrend.
Now the pair is sitting right between this downtrend and a major higher timeframe support zone.
That’s compression.
And usually… the bigger the compression,
the bigger the move that follows.
Many already gave up on ETH after the recent underperformance against BTC.
But structurally, this is exactly where things start getting interesting.
A short-term flush toward support is still possible.
But if that happens, I’ll be watching for bids there very closely.
Because once this monthly downtrend finally breaks,
I think ETH/BTC could move very aggressively again.
I think we forget Bitcoin went from $68K to $83K in literally six weeks. This corrective period we're in is perfectly normal, and healthy.
The same way we formed a solid base around the $65K-$69K level, we are forming a new base between $75K-$79K, so chill out!
We will likely go through this same exercise again between $85K-$89K before we finally break that $100K level, at which point, Bitcoin will likely reach new highs shortly.
Bitcoin always looks ugliest when it's testing the bottom of the range, but everyone thinks it's UP ONLY when it's up against the top of the range, prior to a convincing breakout.
Broadening wedges on software $IGV historically precede massive runs in $BTC.
But what I want to draw your attention to is the period of chop in orange, before the run. Even after the bottom is in, your patience and conviction are still tested.
You will wonder why you are holding bitcoin instead of stocks. Then when it exits the chop, you'll wonder why you bothered to buy anything besides bitcoin.