Gold should have exploded when the Iran war started. It did not. Understanding why it did not is more important than the price itself.
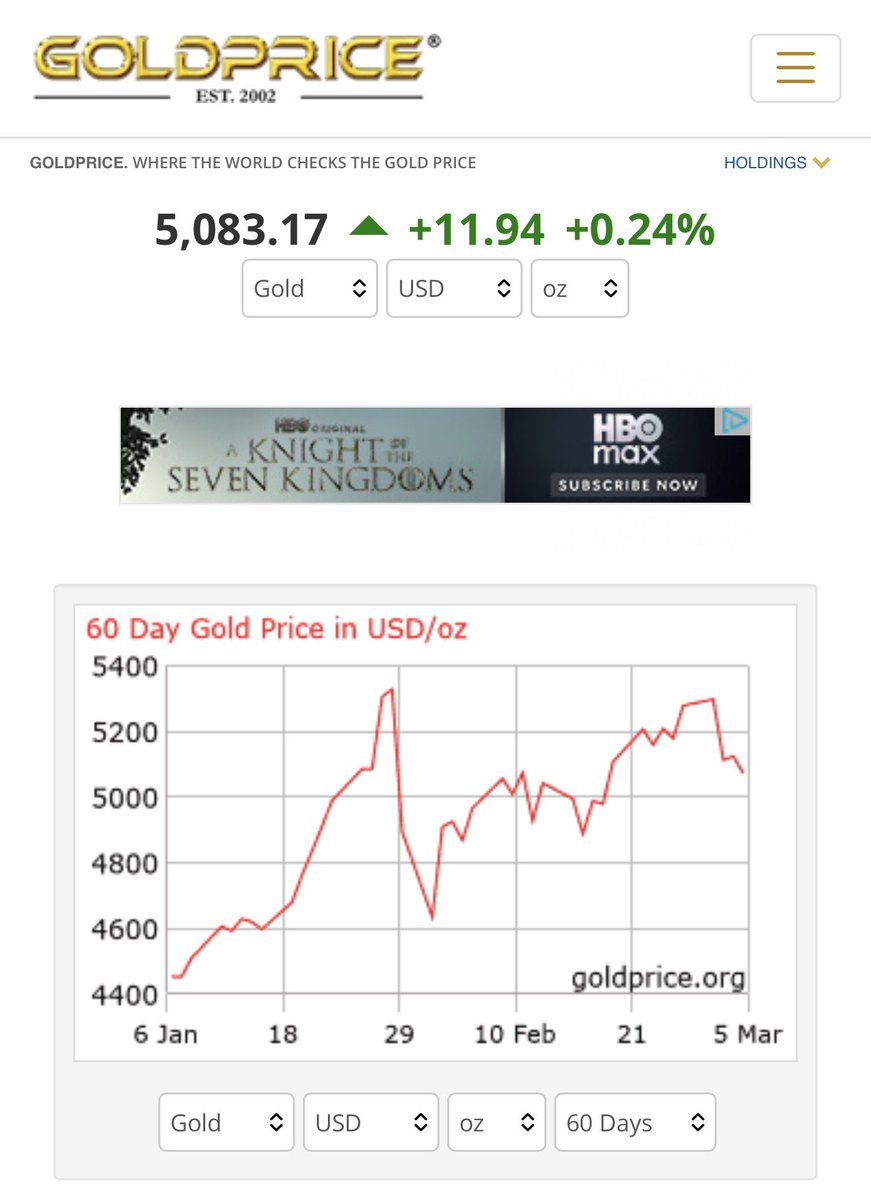
On February 28, when US-Israeli strikes killed Khamenei, closed Hormuz, and destroyed twenty Iranian warships in forty-eight hours, gold spiked to an intraday high of $5,390. By March 4, six days into the largest Middle East military campaign since the Gulf War, gold had dropped approximately 4 percent in a single session. It sits at $5,093 today. Net gain since escalation began: 2.3 percent. Brent crude surged 13 percent. Jet fuel gained 140 percent. Gold gained 2.3 percent.
The question every institutional investor is asking is why.
The answer is the dollar. When oil spikes 13 percent, the mechanism it activates first is not the safe-haven gold bid. It is the inflation expectation channel, which strengthens the dollar, which tightens real yields, which is the one macro environment where gold historically underperforms. The Fed faces its impossible trinity: oil-driven inflation demands rate hikes, growth shock demands rate cuts, war financing demands monetization. Markets read the inflation signal first and bought dollars. The dollar roared. Gold waited.
This is not gold failing. This is gold being temporarily outbid by the dollar in the first phase of an inflation shock. These two phases have played out in sequence in every major energy-driven geopolitical crisis: phase one, dollar strengthens on inflation expectations; phase two, when the sustained economic damage becomes visible and recession probability rises, the dollar weakens and gold surges because the market shifts from pricing inflation to pricing monetary debasement. In 1973 the second phase took roughly six months and produced gold gains of 73 percent. In 2022 Russia-Ukraine it was compressed because the war was geographically contained and the Fed moved fast. In 2026 the relevant question is whether the war duration extends into the second phase window.
Goldman Sachs has already moved. Their end-2026 gold target is $6,300, conditioned on prolonged Hormuz disruption. The probability architecture built from eight days of evidence suggests a 50 percent probability of a one-to-three month conflict. If Goldman’s scenario is correct, the current $5,093 level represents a $1,207 gap between today’s price and year-end target that the market has not yet priced. That gap exists because the market is still betting on a short war. The evidence is betting on a long one.
The $5,000 support level is the number every technical trader is watching. The market is currently defending it. If it holds through the Fed’s March 18 meeting and the UN Security Council session on March 10, the base for the second phase move is intact.
Gold reached $5,062 on February 20, before this war. Thesis Seven predicted $5,000 by Q2. It arrived four months early. The war that arrived February 28 did not create this gold move. It inherited a gold price already priced for civilizational insurance and added a geopolitical premium that is still settling into its correct value.
At $5,093 with Goldman at $6,300, with the Fed paralyzed, with Hormuz closed, with the Israeli Finance Ministry absorbing 9.4 billion shekels per week, and with the dollar’s inflation-driven strength carrying a self-limiting fuse, the gap between what gold is priced at today and what the evidence says it should be priced at is the temporal arbitrage that resolves when the market finishes pricing a short war and starts pricing the one actually being fought.
https://t.co/ULBgEzZ3A8
My trader friend shared these practical & super powerful rules about price + volume. I am not into trading, but when he explained these key aspects, I was impressed.
👉 Simple + Profound 8 golden rules of trading every serious trader should keep in mind!
🎯 BookMark + Use it 💯
1. Fast drop, slow rise → accumulation signal
2. Fast rise, slow drop → sell signal
3. Price rises on low volume → likely to keep rising
4. Price falls on low volume → likely to keep falling
5. Price rises on high volume → pullback is likely
6. Price falls on high volume → rebound is likely
7. Low volume with no upward move → top is forming
8. Low volume with no downward move → top has formed.
FII + DII BUYINGS 🔥
TD Power
Ethos Ltd
Apollo Micro
Paras Defence
Fiem Industries
SML Isuzu
CARE Ratings
Marathon Nextgen
Sky Gold
Shankara Buildcon
Capacit’e Infra
Vintage Coffee
R M Drip & Sprinklers
Innovana Tech
Aries Agro
In stock market.
More you read
More you reduce your chances of failures..
More you increase your chance of survival.
More you increase your chance to be wealthy..
Simple market hack !!!
✨Top 12 Mutual Funds Across Key Categories
🔷 Flexi Cap
🔸 Parag Parikh Flexi Cap Fund
🔸 HDFC Flexi Cap Fund
🔸 Helios Flexi Cap Fund
🔷 Small Cap
🔸 Nippon India Small Cap
🔸 HDFC Small Cap
🔸 Quant Small Cap Fund
🔷 Mid Cap
🔸 HDFC Mid Cap Fund
🔸 Invesco India Mid Cap Fund
🔸 Motilal Oswal Midcap Fund
🔷 Large Cap
🔸 ICICI Prudential Large Cap
🔸 Nippon India Large Cap
🔸 Mirae Asset Large Cap Fund
Disclaimer: For educational purposes only.
📌 Why smart investors don’t wait till March for tax-loss harvesting 🚨👇
Most investors believe tax-loss harvesting is a March activity.
It’s not. ❌
That belief turns a powerful tax rule into a rushed year-end ritual. 😵💫
Here’s the law-aligned way to understand tax-loss harvesting 👇
1⃣ What tax-loss harvesting actually is ⬇️
Under Indian tax law:
🔸 Capital losses can be set off against capital gains
🔸 Short-term capital loss (STCL) → set off against STCG + LTCG
🔸 Long-term capital loss (LTCL) → set off only against LTCG
🔸 Unused losses can be carried forward for 8 years
📌 The law does not say this must be done in March.
2⃣ ₹10 Lakh real example (this is where it gets practical)
Assume this portfolio:
Stock A sold at ₹1.5 lakh profit (STCG)
Tax on STCG @ 20% = ₹30,000 🚕
Now another holding:
Stock B bought for ₹10,00,000
Current value during market correction = ₹8,00,000
Unrealised loss = ₹2,00,000 😭
Without tax-loss harvesting
STCG = ₹1,50,000
Tax @ 20% = ₹30,000 paid to taxman
Loss remains unutilised. 😟
With tax-loss harvesting (during correction)
You sell Stock B and book ₹2,00,000 STCL.
Now tax calculation:
STCG = ₹1,50,000
STCL set-off = ₹1,50,000
Net taxable STCG = ₹0
👉 Tax saved = ₹30,000 😀
Remaining loss:
₹50,000 STCL
Can be carried forward for 8 years 🤝
Use later when gains eventually arise 👍
📌 Same market exposure can be maintained by switching into another quality stock ✅✅
3⃣ Why market corrections are the real opportunity
During corrections 📉👇
Even good stocks show losses
You can: Upgrade portfolio quality + Create tax shields + Reduce future tax burden
This is portfolio optimisation + tax efficiency, not panic selling 📈
4⃣ Why waiting till March often backfires
By March:
Prices may have already recovered
Losses may disappear
Decisions become tax-driven, not investment-driven
March is the deadline, not the opportunity 👍
5⃣ Tax-loss harvesting is about upgrading, not exiting
The best use of tax-loss harvesting is when 👇
1. You replace a weaker holding with a stronger one
2. You rebalance into better asset allocation
3. You reduce future tax on gains without changing risk profile materially
Smart investors don’t “sell and sit in cash”.
They sell, replace, and optimise.
Core message 🔥👇
Tax-loss harvesting is:
✅ Market-driven, not calendar-driven
✅ Strategic, not reactive
Most powerful when markets are down, not when deadlines approach ✅
Smart investors harvest losses when fear creates opportunity. ✅
Disclaimer: This post is for informational and educational purposes only and does not constitute investment or tax advice.
⚡️Disclaimer: The above data should not be considered as a Buy or Sell recommendation. The analysis has been done for educational and learning purpose only.