$BTC HAS THREE RULES IN A BEAR MARKET
It's easy:
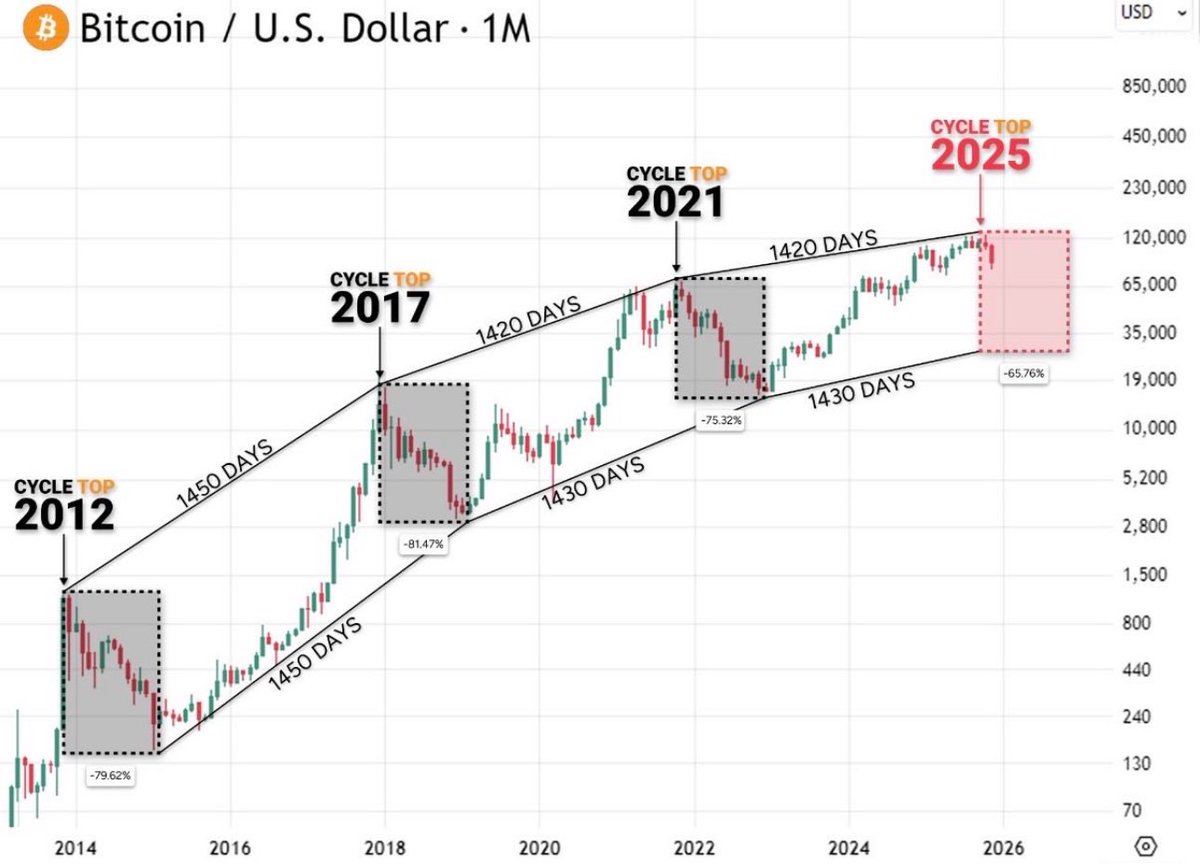
Rule 1 - Bear market lasts minimum 350 days
Rule 2 - The bottom never forms without touching MA 350
Rule 3 - Price always drops further than anyone expect
Good news: By the timeline we're already 65% through the bear cycle
But the price is still at $80,000. And the 350-day moving average is at $47,000 - completely untouched
Not worried though. There are too many things working against this bullish moment right now. The flush is coming. It always does
When MA 350 gets tagged - that's when I'll be the loudest bull in the room
FOLLOW + NOTIFS ON!
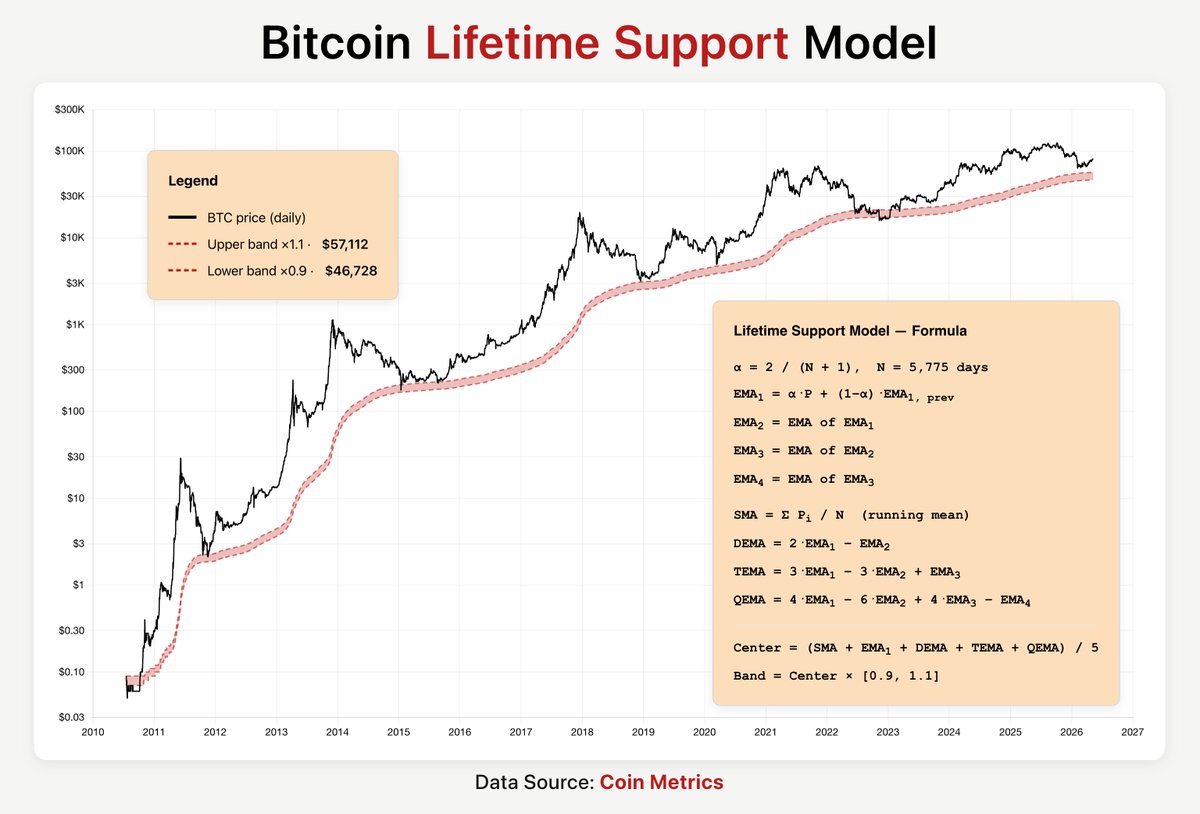
New Bitcoin Floor Model!
Simple and elegant.
Equal-weighted average of BTC's lifetime SMA, single EMA, double EMA (DEMA), triple EMA (TEMA), and quadruple EMA (QEMA), then plot a ±10% band around that average.
Upper band ×1.1 = $57,112
Lower band ×0.9 = $46,728
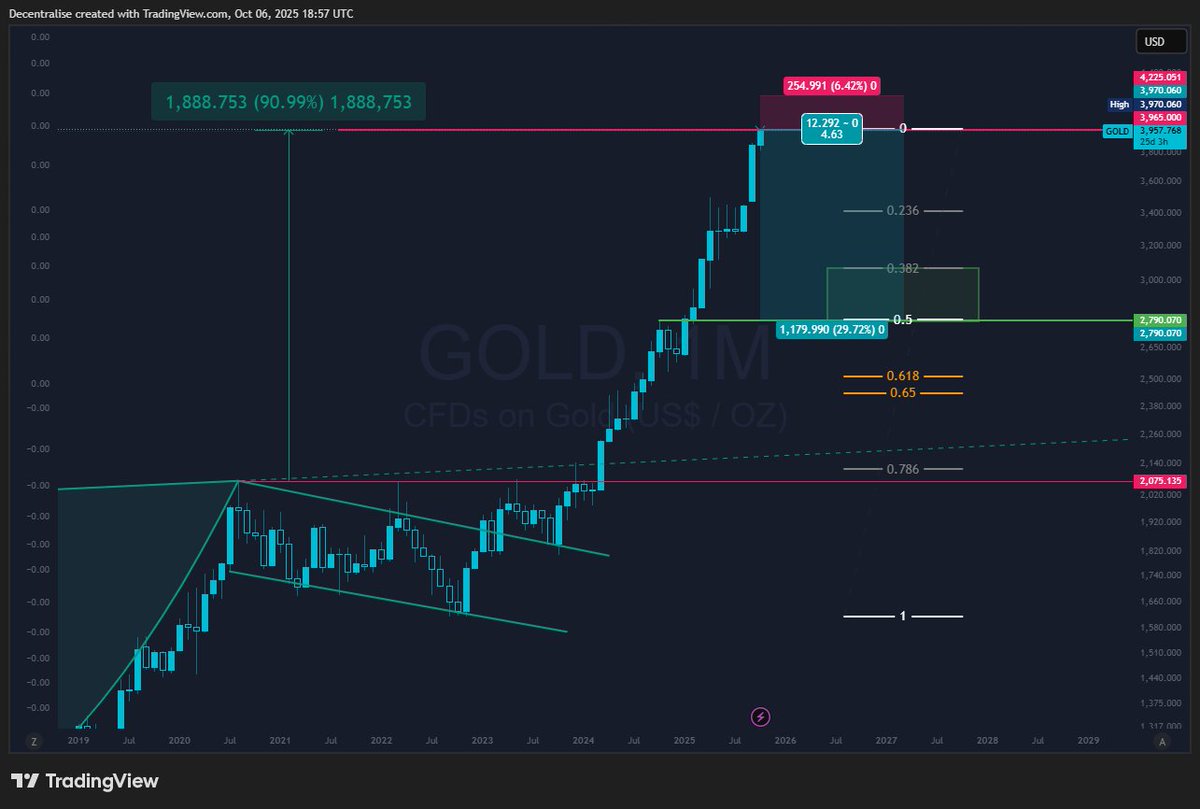
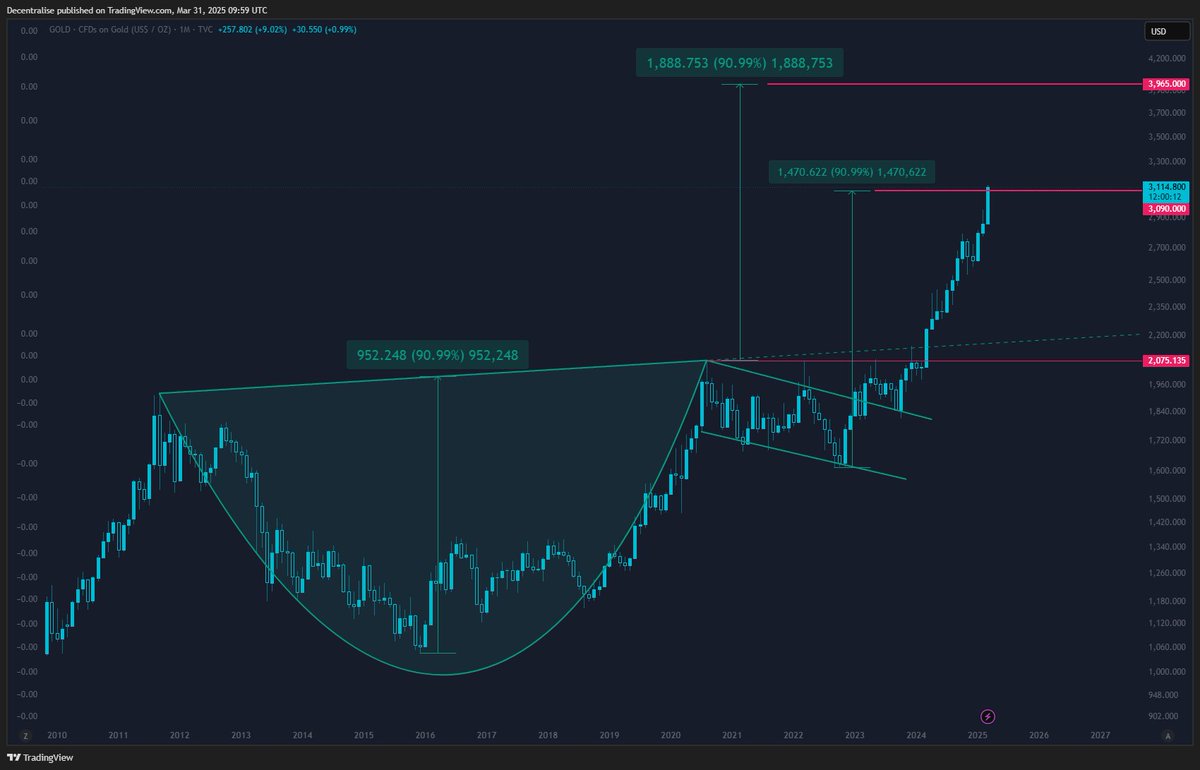
Very interesting. $GOLD up so much = $USD dropped so much, making USD not as reliable for true price of BTC.
According to GOLD pair, $BTC has already dropped -70% this bear market.
Another dip would line up with previous cycle bear duration + form RSI bull div confirmation.
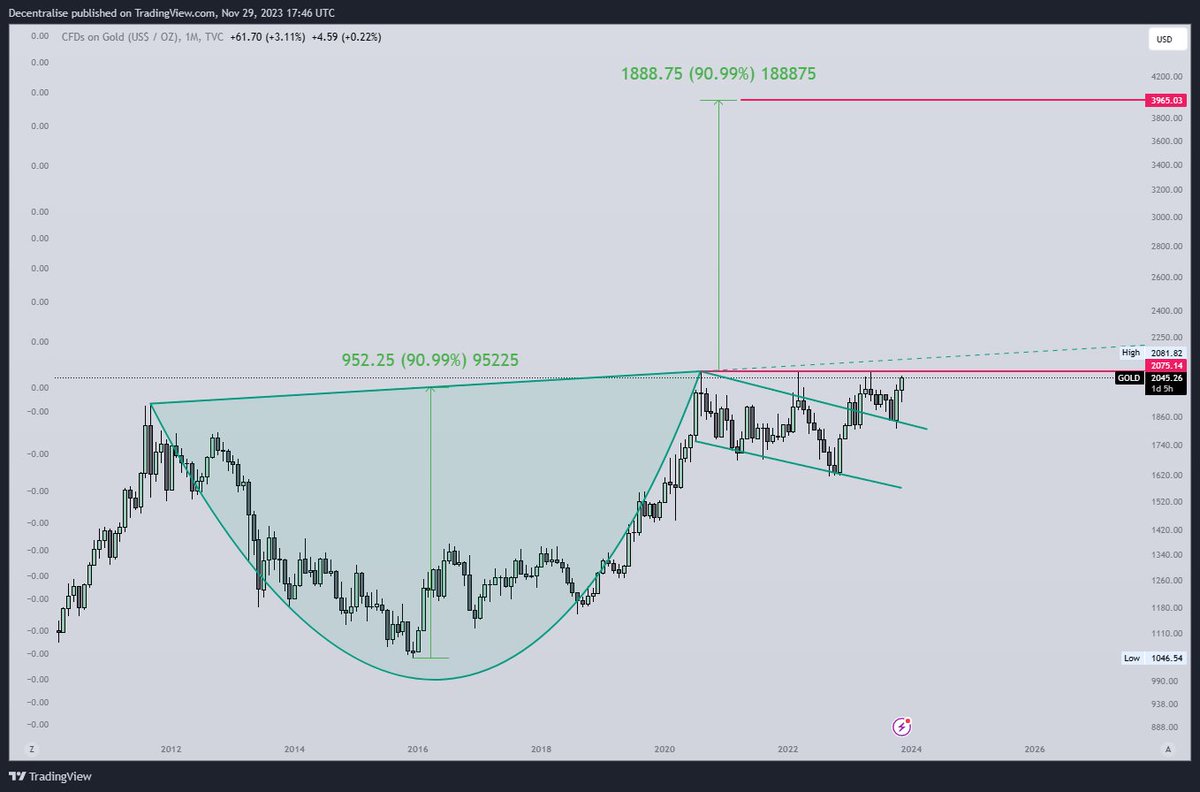
Gold and Bitcoin
Last cycle, gold ran hard.
Bitcoin went up, but also dropped -70%.
No real parabolic move for BTC
That parabolic Bitcoin move started exactly once gold went into a long consolidation period.
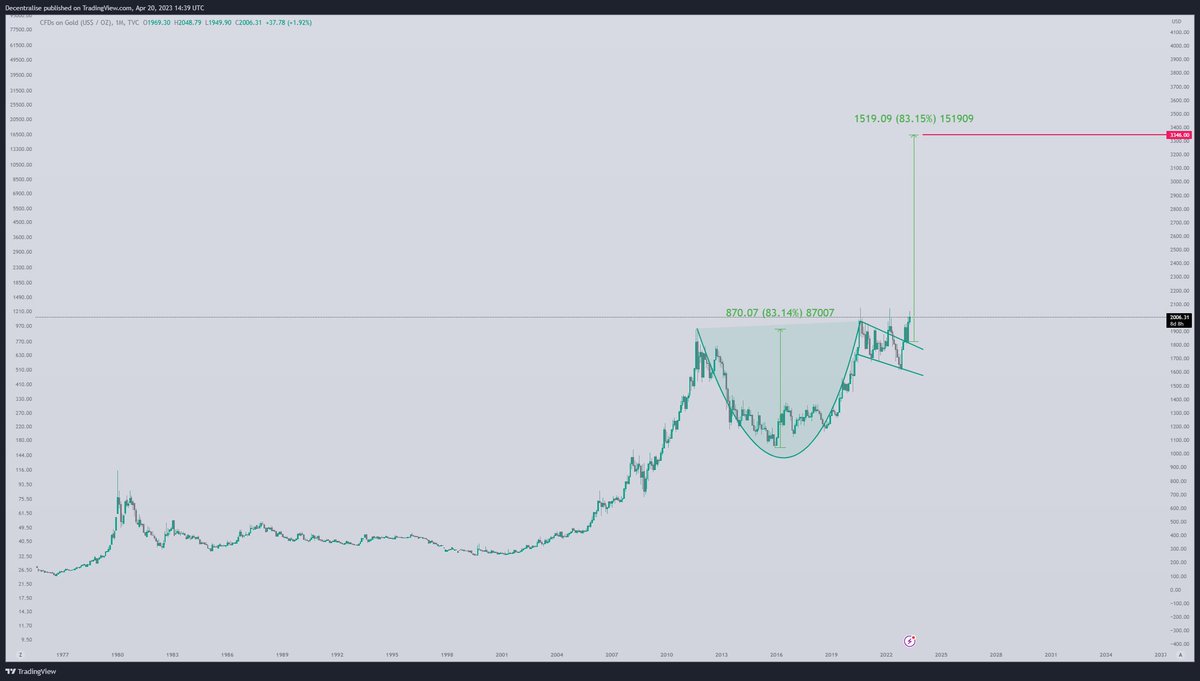
Gold and Bitcoin
Last cycle, gold ran hard.
Bitcoin went up, but also dropped -70%.
No real parabolic move for BTC
That parabolic Bitcoin move started exactly once gold went into a long consolidation period.
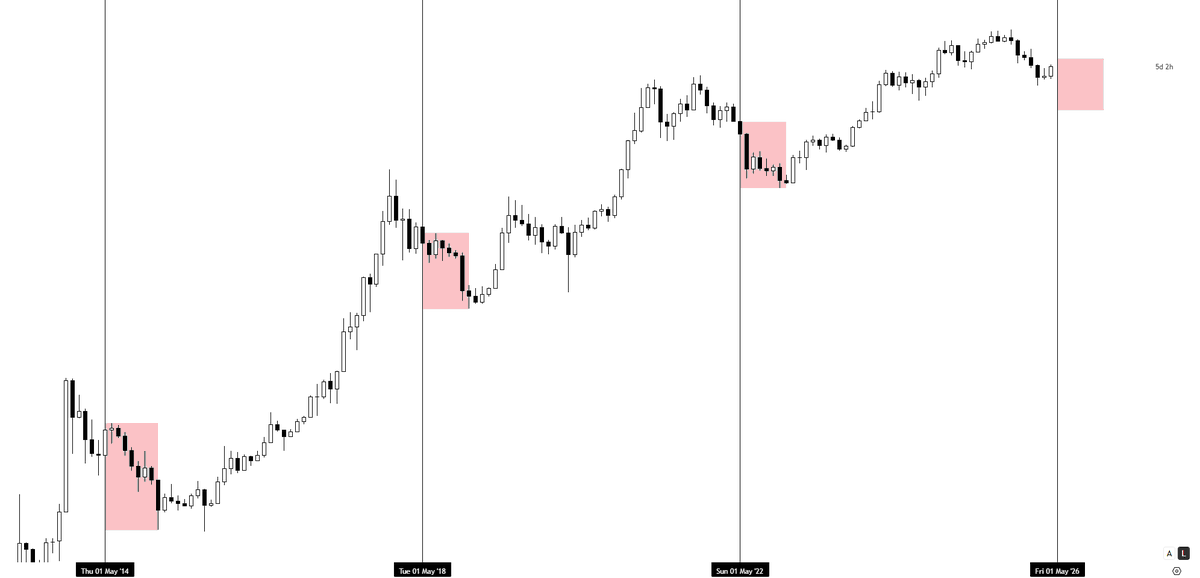
After May could be brutal.
In every single $BTC bear cycle, once April passed, we’ve seen extended downside follow through Q3.
Are you really willing to bet against that?
$BTC #BTC#Bitcoin M1 (Monthly)
Last cycle, at this stage a monthly close below previous months high triggered 3 months of heavy bleeding.
If April closes below March high of $76,000, expect heavy bleeding in May, June & July.
$BTC #BTC#Bitcoin W1
Previous bear market vs current
Numbers and levels match shockingly well so far
(CME gap open up to $84.3k, which if filled would put current bounce at 40% - a bit closer to previous cycles 46%, but this Nov/Dec bounce was also weaker at 21.49% vs 24%..)
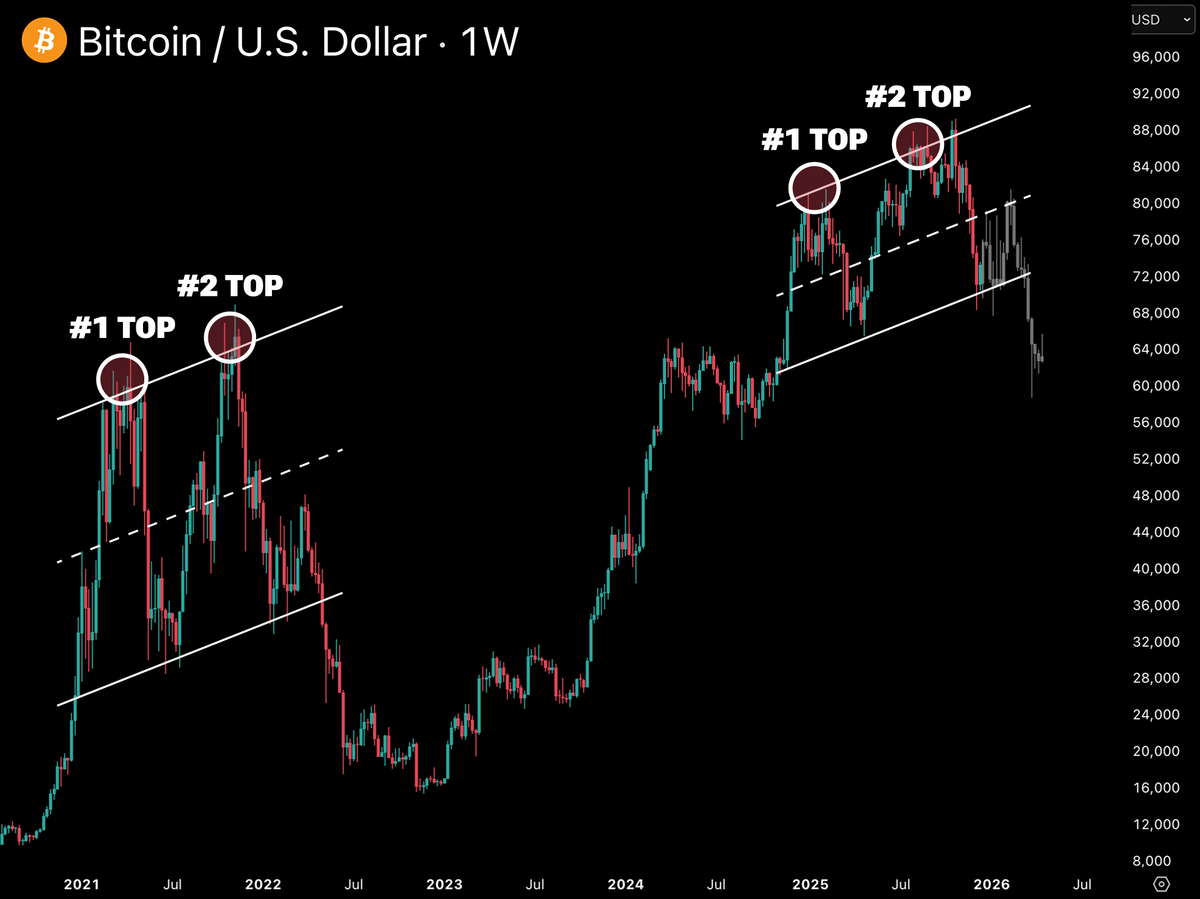
Can’t stop thinking about this chart.
Every $BTC rejection from this line has led to a 70% crash.
And we just bounced off it again.
Who’s ready for $40,000 $BTC?
Bears think $126k was the top, and btc will fall below $100k, and 2026 will be a bear market mainly because ... the 4 year cycle!?
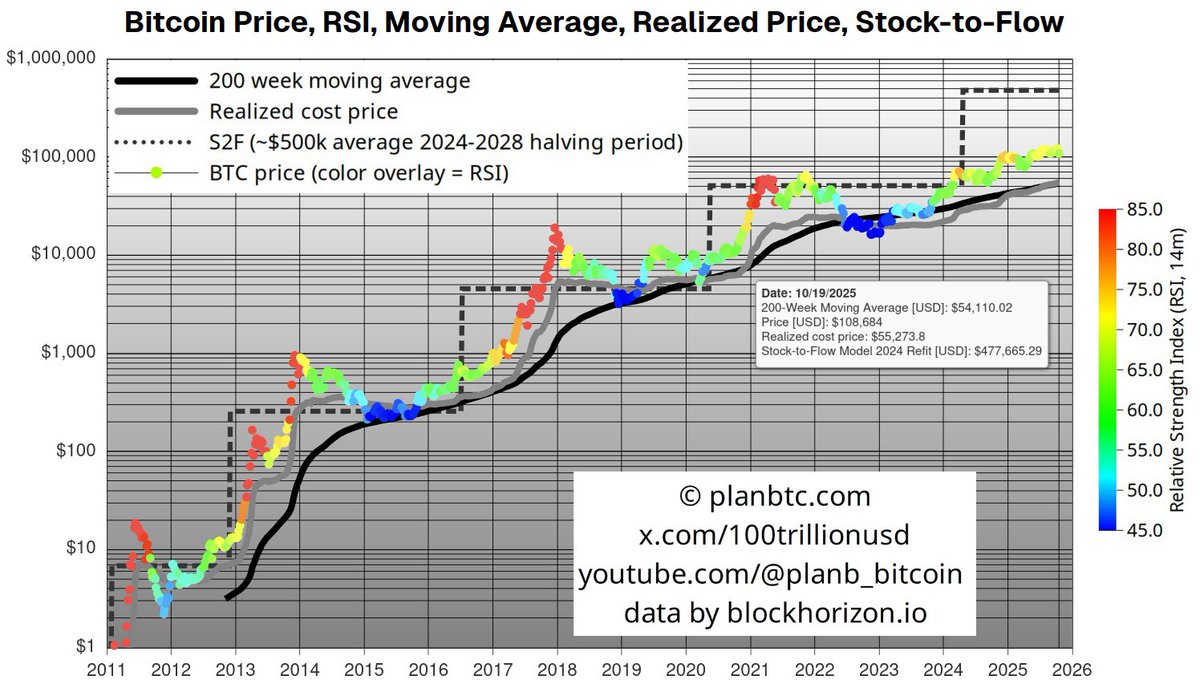
IMO that is a BIG misunderstanding. Yes, there is a 4y halving cycle that doubles S2F-ratio, and 6 months before until 18 months after a halving was very profitable last 3 cycles. But, 3 cycles is not enough for a reliable pattern, and it is absolutely not guaranteed that the top is again 18 months after the halving (Oct'25!). Also, S2F model says nothing about tops or bottoms, only about the average price level in a halving cycle, assuming a fundamental phase transition (as described in the S2FX article, on my website in the bio). So IMO the top could very well be in 2026, or 2027, or 2028 ... actually I am much more interested in the average price level than the top (or the bottom).
What I do know is: there has not been a fundamental bitcoin phase transition yet in this cycle. Realized price (grey line) has not diverted from 200 week moving average (black line), RSI has not been 80+ (red) etc. Either the big jump has yet to come, or we have transitioned into a more stable price regime, dominated by institutions, fund mandates (e.g. 1%-10% btc) and rebalancing (sell after pump and buy after dump, to keep exposures within mandate). Both scenarios are very bullish for bitcoin. Also, IMO there can not be a big bear market without a big jump (red RSI 80+ and grey realized price diverting from black 200wma).
$BTC #BTC#Bitcoin W1
Halving to all-time-high
Date ranges get longer every cycle, this might indicate we have a few more weeks left to print the current cycle's all-time-high..