🚀Just wrapped up my Coffee Shop Sales Analysis Project using Excel!
Analyzed sales from 3 NYC branches
✅ Cleaned & transformed data
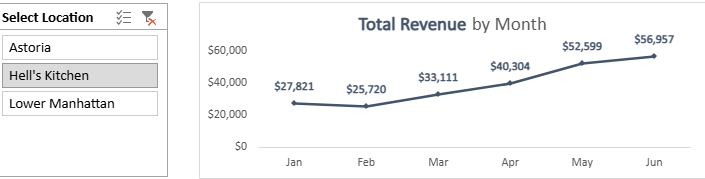
📊 Found that Hell’s Kitchen leads in revenue
📈 Astoria shows strongest growth
@hnginternship#DataAnalytics#Excel#DataVisualization#Kaggle
5.Recommendations
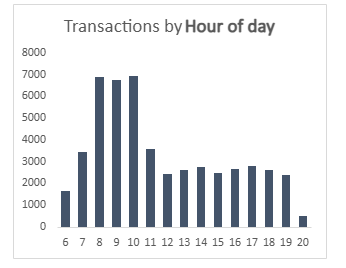
Focus promotions in June and during high-traffic hours
Leverage Astoria’s growth potential for expansion
Optimize staffing and hours in Lower Manhattan
3. Data Cleaning Process
Removed duplicates and standardized date/category formats
Added 6 new columns for deeper insights (like Revenue and sales per hour)
Ensured consistent product and location names for accuracy
2. Dataset & Tools
Dataset: Coffee Shop Sales by Ahmed Abbas on Kaggle.
Tool used: Microsoft Excel only for data cleaning, analysis, and visualization.
No fancy software, just clean formulas and charts.
1. About the Project
I analyzed sales from three NYC coffee shop branches - Hell’s Kitchen, Astoria, and Lower Manhattan using Excel.
The goal was to understand store performance, product trends, and time-based sales patterns. ☕📊