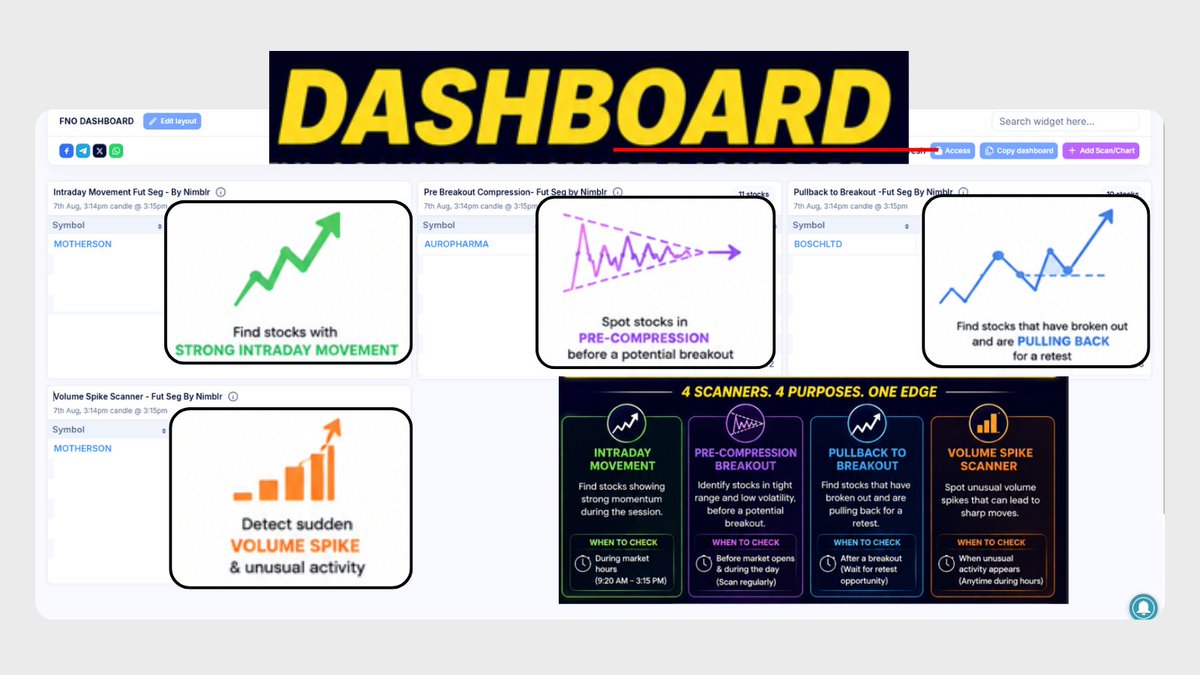
I built this Dashboard.
→ Intraday Movement
Find where the day’s momentum is already showing up.
→ Pre-Compression Breakout
Spot stocks where price is tightening before expansion.
→ Pullback to Breakout
Find stocks that have broken out and are retesting instead of chasing.
→ Volume Spike
Identify where participation is suddenly increasing.
When to check:
⏱️ Intraday Movement → during market hours
⏱️ Volume Spike → when unusual activity appears
⏱️ Pre Compression → before the expansion
⏱️ Pullback → after a breakout, while waiting for the retest
Access link below
Filtering segment - Futures on chartink
#stockmarketindia
Let NSE build your FnO watchlist before 9:15 AM.
I prefer starting here:
NSE → Market Data → Derivatives Market
→ Pre-Open Market → Equity Derivatives
Bookmark this and try it tomorrow morning.
Around 9:07 AM:
→ Sort by Change % / Change (Pts)
→ Focus on the top 3 - 5 FnO stocks
→ Note where the strongest pre-open activity is
Now here’s the important part:
Gap up ≠ Buy.
Preopen data tells you WHERE to look.
Price action tells you WHEN to trade.
#nse #optionstrading #stockmarketindia
Most traders use RSI.
Very few understand how to use it with the trend.
That's where the RSI 60–40 + 21 EMA + 50 EMA framework changes everything.
Here's the idea:
🟢In a strong uptrend:
• Price stays above the 21 EMA & 50 EMA.
• RSI often finds support near 40 → High-probability pullback opportunity.
• RSI pushing above 60 → Momentum is returning and the trend is ready to continue.
The edge isn't the indicator.
The edge is the confluence between:
✅ Market Structure
✅ Dynamic Support (21 EMA & 50 EMA)
✅ RSI 40–60 Behavior
✅ Price Action Confirmation
✅ Strict Risk Management
Remember:
��� Don't buy just because RSI is at 40.
❌ Don't buy just because RSI crosses 60.
Wait for price confirmation.
Indicators only support the decision.
Price always makes the final decision.
📌 Save this note and study it before your next trade.
💬 Have you ever combined RSI with the 21 EMA and 50 EMA? Share your experience below.
Follow @ChartMantra_ for practical trading education, high-probability setups, and risk management that help you trade with discipline-not emotions.
♻️ Repost if this added value to your trading journey.
This strategy made me $1.5M in trading profits last quarter.
I’ve spent 7 years refining it & stripping away everything that doesn't work.
Now it's an easy, repeatable process that anyone can follow.
Below you can steal my exact Smart Money Concepts trading strategy:🧵
After years of studying charts, testing ideas, and reviewing thousands of trades
This is the setup I trust the most.
⭐ My 5-Star Setup
✅ Monthly RSI > 60
✅ Weekly RSI > 60
✅ Daily RSI near 60 or Daily RSI near 40 with a bullish candle
Why does it work?
Because it combines the strength of multiple timeframes.
📈 Monthly RSI > 60 confirms long-term momentum.
📈 Weekly RSI > 60 confirms the intermediate trend.
🎯 Daily RSI provides precise entry timing.
This helps me trade with the trend instead of against it.
But one important rule:
I don't buy because RSI reaches a level.
I wait for price action confirmation and always manage my risk.
A great setup without discipline is still a bad trade.
📌 Save this post and use it as your pre-trade checklist.
💬 If you could add one more filter to improve this setup, what would it be? Volume, Stage Analysis, 21 EMA, Relative Strength, or something else?
Follow @ChartMantra_ for practical trading education, high-probability setups, and disciplined risk management.
♻️ Repost if you believe trading is about process, patience, and probability-not prediction.
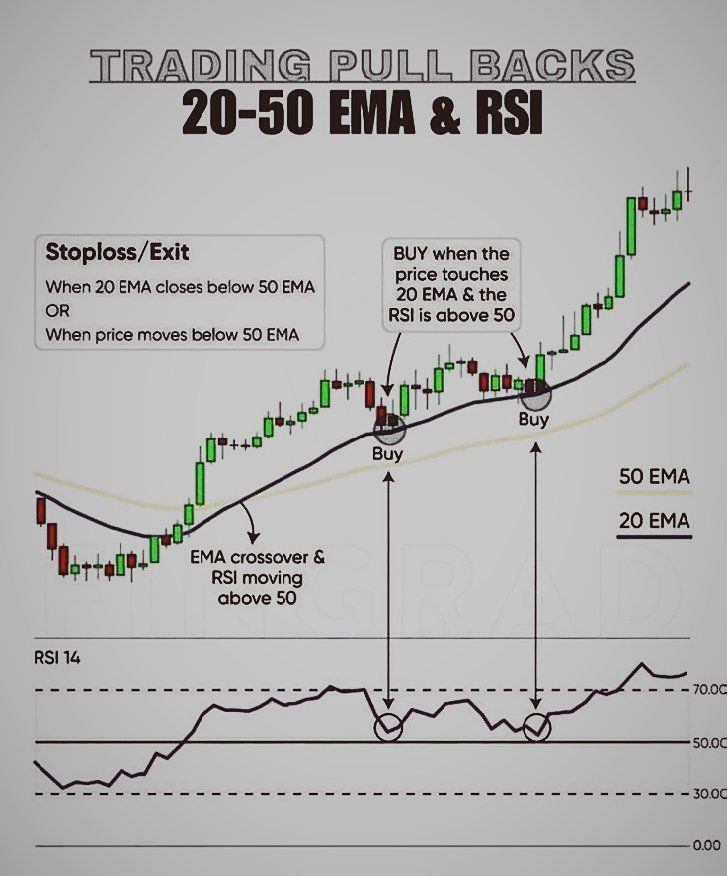
📥 Entry Rules (Buy Setup):
Enter only when the 20 EMA flips above the 50 EMA (uptrend confirmed).
Make sure RSI (14) stays above 50 to validate strength.
Buy the dip when price pulls back to the 20 EMA while RSI remains above 50.
📤 Exit / Stop-Loss Rules:
Exit immediately if the 20 EMA slips back below the 50 EMA, or
If price closes below the 50 EMA (trend weakening).
💡 Why This Works:
A clean pullback strategy that rides an established uptrend using EMA alignment + RSI strength for confirmation.
#trading
EMA 17 – EMA 72 Stratejisi (Margasi46 Tekniği)
⏱ Periyot: Günlük grafik
Bu strateji, erken dönüşleri yakalamak ve yanıltıcı yükselişleri filtrelemek için geliştirilmiştir.
1️⃣ Grafiğe EMA 17 ve EMA 72 ekle.
2️⃣ EMA 17, EMA 72’nin altından yukarı keserse → AL sinyali🟩
3️⃣ EMA 17, EMA 72’nin üstünden aşağı keserse → SAT sinyali🟥
4️⃣ Kesişim öncesi iki ortalama EMA 17 ile EMA 72 arasındaki mesafenin belirgin şekilde daralması genellikle büyük hareket öncesi sessizliktir.
5️⃣ Bu daralma sırasında hacim artışı varsa, kırılımın yönü sert olur.
Avantajı: Mum analizi gerekmez. Ortalamalar sana sessizce yönü söyler.
✍️Önemli Not: Bu strateji en iyi trendli piyasalarda çalışır, yatay günlerde kullanılmamalıdır.
@afzal_57 Sir, 2021 batch here. I’ve built a similar framework called P.R.E.P. Would love your expert take on how to refine it. Have a look when you can!
https://t.co/KYKnstsZVS
Most studies are done backwards - they find stocks that exploded and then find chart patterns before they exploded. The result is - forced patterns. They draw lines and find breakouts everywhere all the time. Doesn't make sense to me..
I'll give you ONE pattern - I call it the Wavy Base Pattern (WBP), very rare. You'll train your eye like never before. You'll spot real A+ breakouts like never before.
I'll share 100 charts - A+ WBP Breakouts that look exactly same all the time.
Before I start, I just want you to bookmark this and come back at #100 and tell me if your eye changed.
ADRMAX - My best work yet.
https://t.co/dnFADeZ8fW
Private | Protected
ADR includes everything.
ADRMAX looks only at meaningful moves.
It scans past data, picks out strong green days, takes the top % of those moves, and averages them.
The result is a realistic benchmark for how much a stock can move when it expands.
EVWAP
https://t.co/OuWadsZWHr
Public | Open source
VWAP anchored to earnings.
Plots one VWAP from earnings day and another from the first session after, giving clean reference levels around the event.
Useful for tracking post-earnings reaction and key support/resistance zones.
Relies on TradingView earnings data, which may not always be accurate.