Gold moves in 7-to-8 year cycles.
The pattern has held for 50+ years.
1974 → 1980: 7 years
1980 → 1987: 8 years
1987 → 1994: 8 years
1994 → 2003: 8 years
2003 → 2008: 7 years
2008 → 12/2015: 8 years
12/2015 → August 2020: Early cycle bottom
October 2022 marked another early 8-year cycle bottom.
A break of the 2020 all-time high would be STRATEGICALLY OUTRIGHT BULLISH.
THE BIBLICAL ORIGIN
The cycle comes from the Bible story (Genesis 41).
Pharaoh's dream: Seven fat cows and seven lean cows.
Interpretation: Seven years of high yields followed by seven years of famine.
The Egyptians didn't just build pyramids. They predicted financial markets 3,500 years into the future.
WHEN GOLD OUTPERFORMS
Gold works well in times of unrest.
1976-1980 (hyperinflation):
S&P 500: 10.8% p.a.
Gold: 56.3% p.a.
2001-2011 (tech bubble + financial crisis):
S&P 500: 2.4% p.a.
Gold: 20.6% p.a.
After a prolonged sideways movement, gold has now reached a new high.
This is OUTRIGHT BULLISH.
THE SETUP FOR 2026
If we're entering a new cycle, the target by 2028: $15T market cap.
That's a massive leg up from current levels.
THE CASE FOR GOLD MINERS
Most gold companies have restructured.
– Balance sheets cleaned up
– Cost structures streamlined
– Solid free cash flow
– Shareholder-friendly dividends
The scenario that benefits them most?
US recession + Fed cuts rates + gold rallies + fuel prices ease.
Double boost to profits:
1. Rising gold price
2. Falling input costs (fuel)
But as always: Gold mines are a thing of their own.
You either believe in the ancient metal or you don't.
There is nothing in between.
PS: I'm a gold bug.
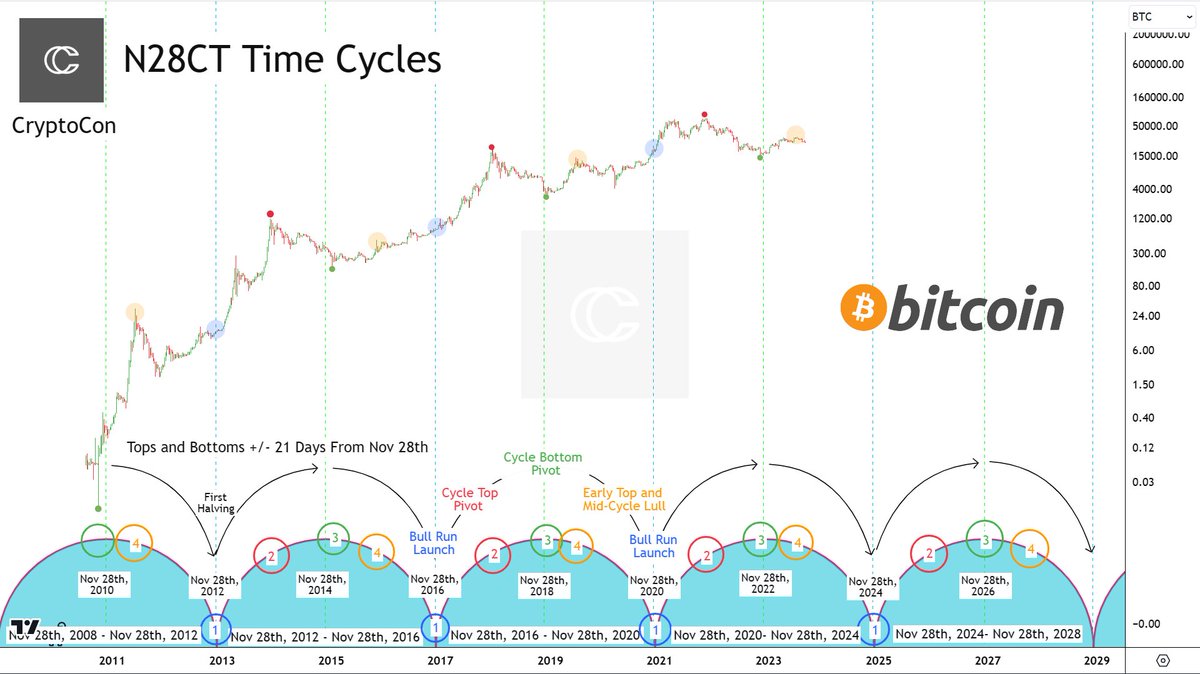
Maybe, I have finally cracked the #Bitcoin code.
The November 28th Cycles Theory has held the key.
Using 4-year time cycles against my Theory, produces Bitcoins exact behavior in time since its inception.
Cycles are centered around the date of the first halving Nov 28th.
Bitcoin price action began at the first bottom October 8th, 2010. This is where cycle curves peak, every 4 years.
Tops and bottoms come +/- 21 days from Nov 28th at their appropriate times on the curve. Tops on the upswing, bottoms on the pinnacle.
After Bitcoin bottoms, price makes an early first cycle move (orange) and enters into a mid-cycle lull.
This is the longest part of the cycle, where Bitcoin spends time around the median price (half of previous ATH), until the curve bottoms.
The bottom of the curve launches the majority of the bull run (blue circle).
The thought that everyone is expecting 4-year cycles allows them to continue right on track. Things like price and exact timing maintain surprise.
These times cycles continue to hold true to this day. We have now almost certainly put in the early top (4) and are entering the mid-cycle lull.
These take place in June in the year following the bottom. The second cycle did this in 2 years after, in June 2016.
The bull run will launch on Nov 28th, 2024.
The next top will be +/- 21 days from Nov 28th, 2025.
The next bottom will be +/- 21 days from Nov 28th, 2026.
The next mid-cycle lull: June 2027.
#btc
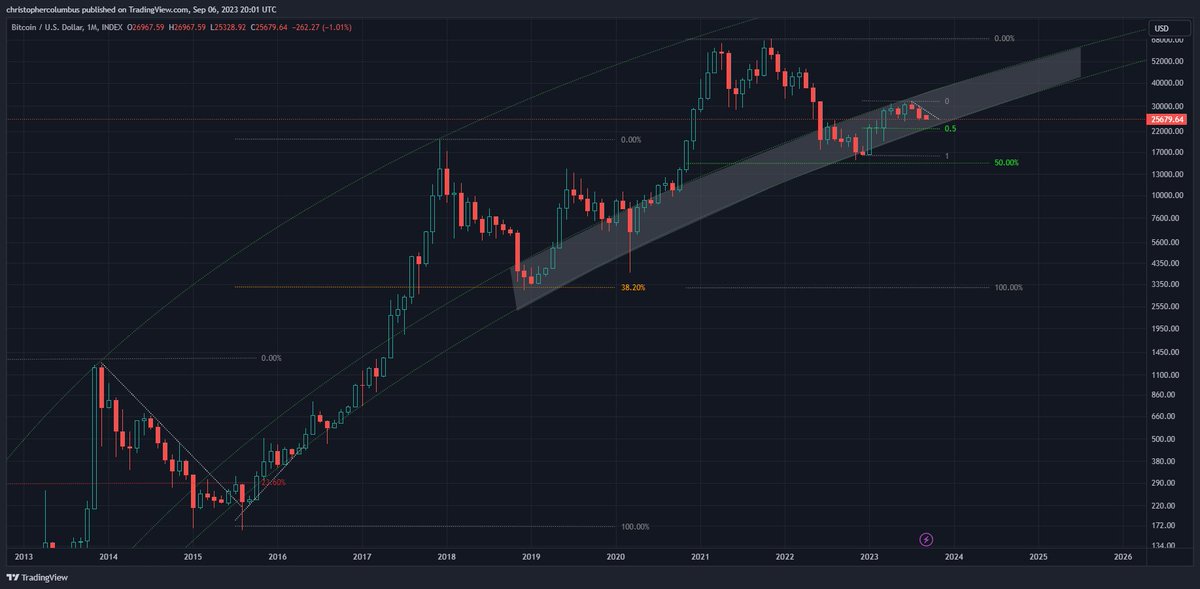
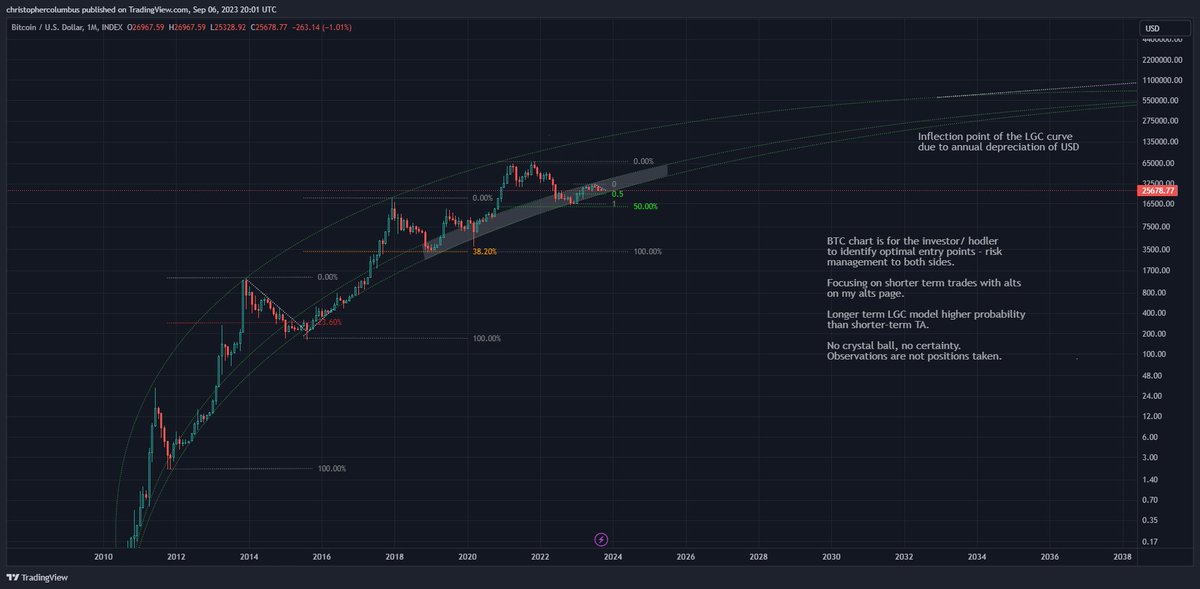
Never fear, the LGC is here. 😎
No need to be inundated with data that simply overwhelms you one way or the other, or even just leaves you further confused.
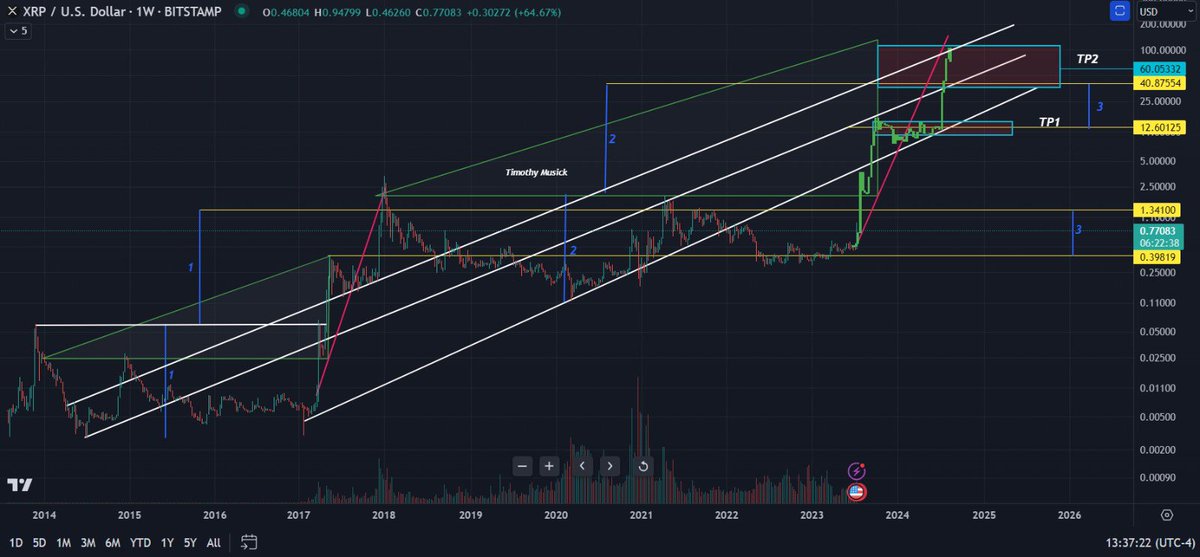
#XRP could reach $40 by September. If we follow the same monthly percentage increases price will hit $1.70 this month, $6 in August and around $40 in September.
#Bitcoin parabola is imminent, we proved it
So what does this look like, in actuality?
I ran the numbers... you're going to like what I found
According to diminished parabolas, 130k is the next target
Rough time frame, April 2024
See for yourself:
https://t.co/0W2zpTMPlD
Just sit on your hands and watch history unfold in front of you
$XRP
If Apple can be worth 3trillion MC for phones, imagine what restructuring banking looks like.
Stay short sighted and get out of my way, I’ve got bigger goals.