Treasury yields have been on a run: 2y at 4.10% and the 10y at 4.65%. Both at their highest levels since March 2025. Fed fund futures now indicating a 70% chance of a rate *hike* by December.
This captures a common misperception about $UBER. $UBER (+8% today) is a ride-hailing platform with 200 million monthly active platform customers (+19% YoY) and 10 million active vehicles. UBER’s app connects its 200M MAPCs and 10M vehicles. By comparison, Waymo has 3,000 robotaxi vehicles on its platform. Once $UBER offers full unsupervised autonomous ride-hailing across the globe with 2-3 minute wait times at the same cost as Waymo (its existing platform already operates at high efficiency), there will be no reason to take a Waymo. Many $TSLA bulls here who think of UBER as just an app don’t understand the concepts of brand and operational leverage.
Uber Proved Bears Wrong Again:
Gross bookings up 21% YoY to $53.7B
•Non-GAAP EPS up 44% YoY
•$3 billion in buybacks, a single quarter record
•AV trips grew 10x year-over-year
•Uber One crossed 50M members
https://t.co/iy6ZUmzVzf
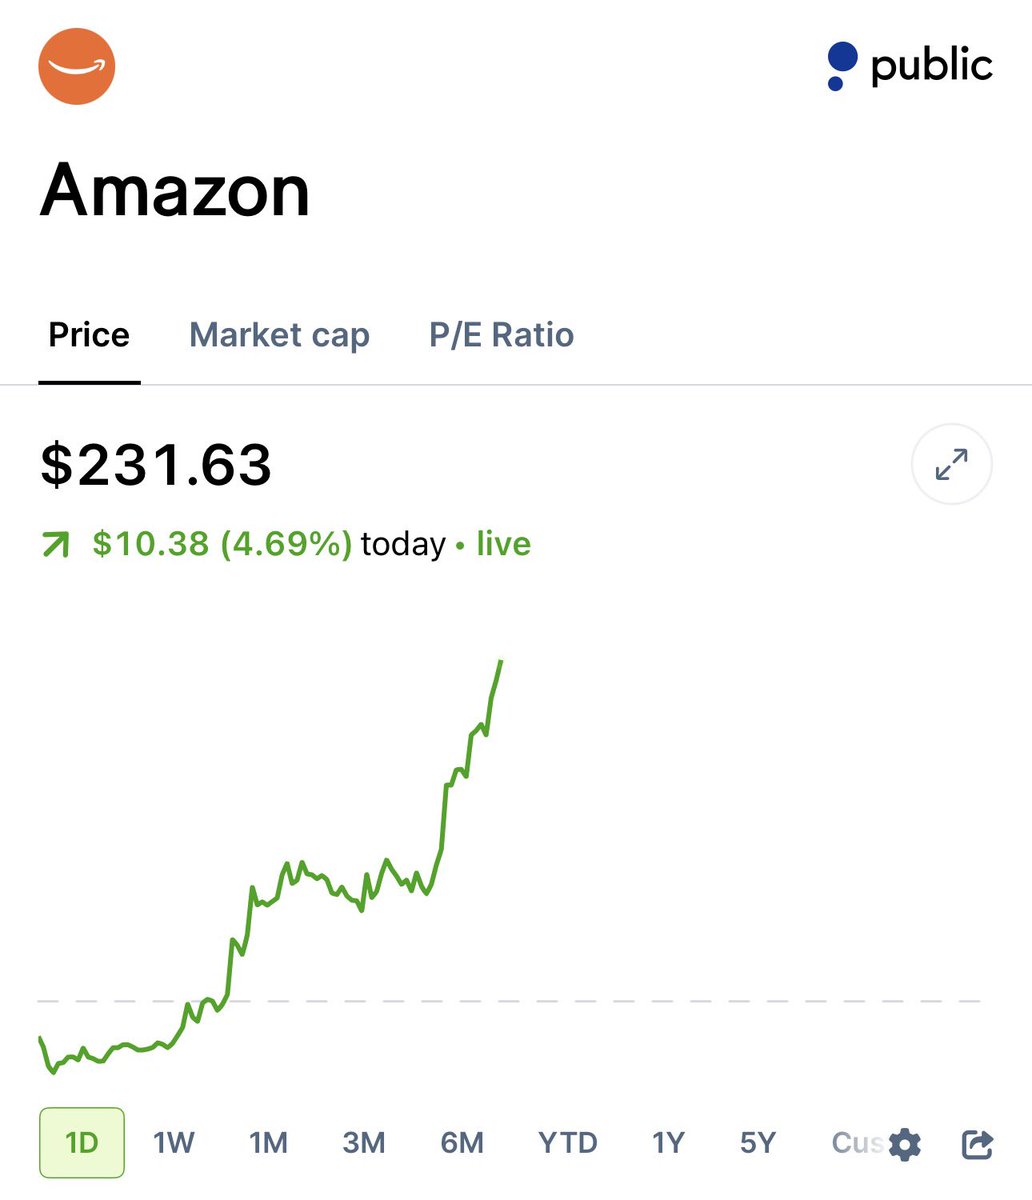
$AMZN is up ~5% after CEO Andy Jassy said two large AWS customers wanted all of Amazon’s 2026 Graviton capacity.
He also said Amazon’s chips business would be running at about $50B annually if it were a standalone business with Trainium4 already sold out before shipping.
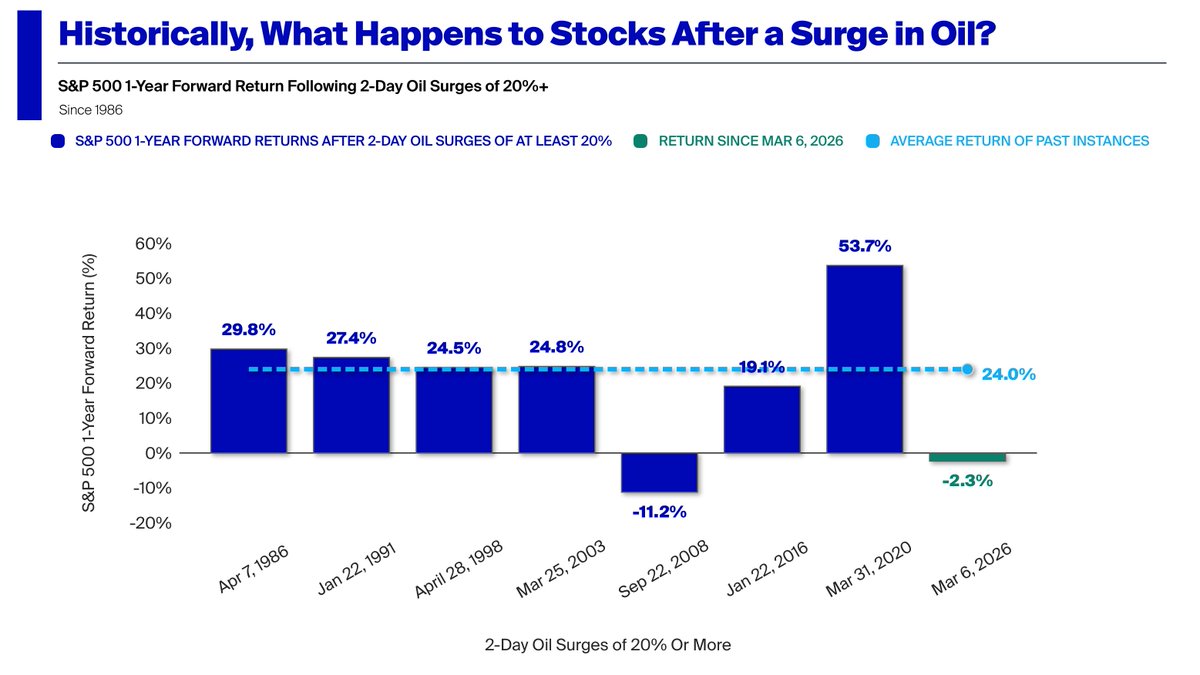
The S&P 500 is down 2.3% since the Iran oil shock began.
Easy to be bearish right now but worth remembering that stocks gain 24% over 12 months after oil shocks on average dating back to 1950.
What is the greatest #AprilFoolsDay joke of all-time?
I'm going to say it was four years ago today, when the yield curve inverted. We were promised a recession and an endless bear market.
Instead we've seen a huge rally and an economy that has been extremely resilient.
This is no early April Fools' joke, but Thursday is down an annualized 147.6% this year for the S&P 500.
Monday is up 108.2% at least, but that isn't making up for Tuesday, Thursday, and Friday.
As ugly as this market has been, here's a pretty crazy statistic...
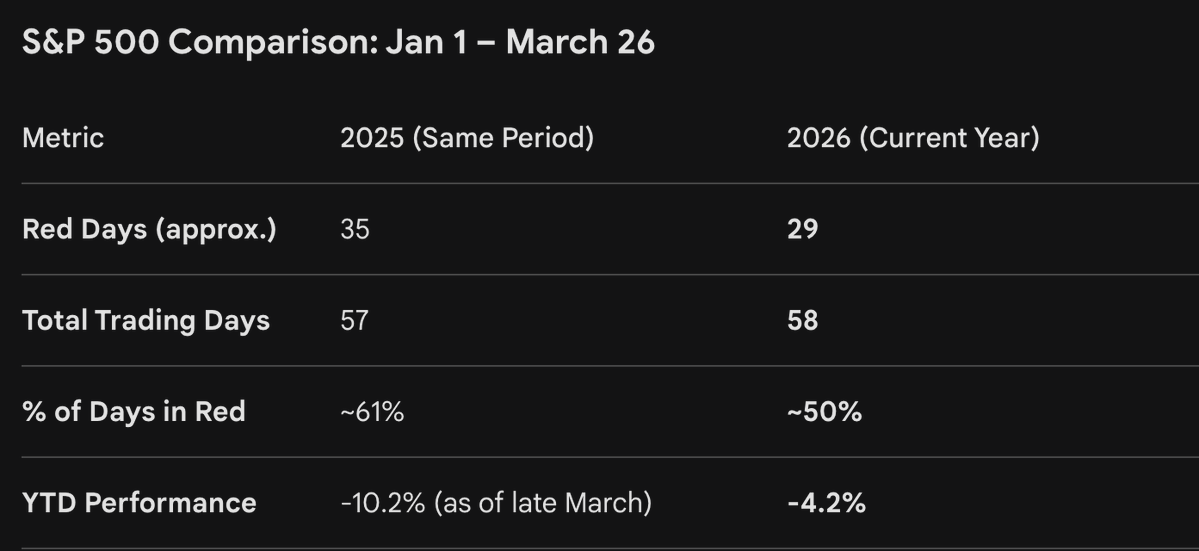
From Jan 1st to March 26th of this year, the S&P $SPX has had 29 out of 58 days close red. 50% of the year has been red and the index is down 4.2% YTD.
From Jan 1st to March 26th of 2025...
1. The S&P was down 10.2%, significantly worse than the current decline.
2. 61% of days, 35 out of 57, were red. 11% more than the 50% of red days this year.
As ugly as this market feels, likely because of the whiplash up and down based on the war headlines, last year was worse during the same time period.
Hopefully 2026 doesn't get as bad as 2025.
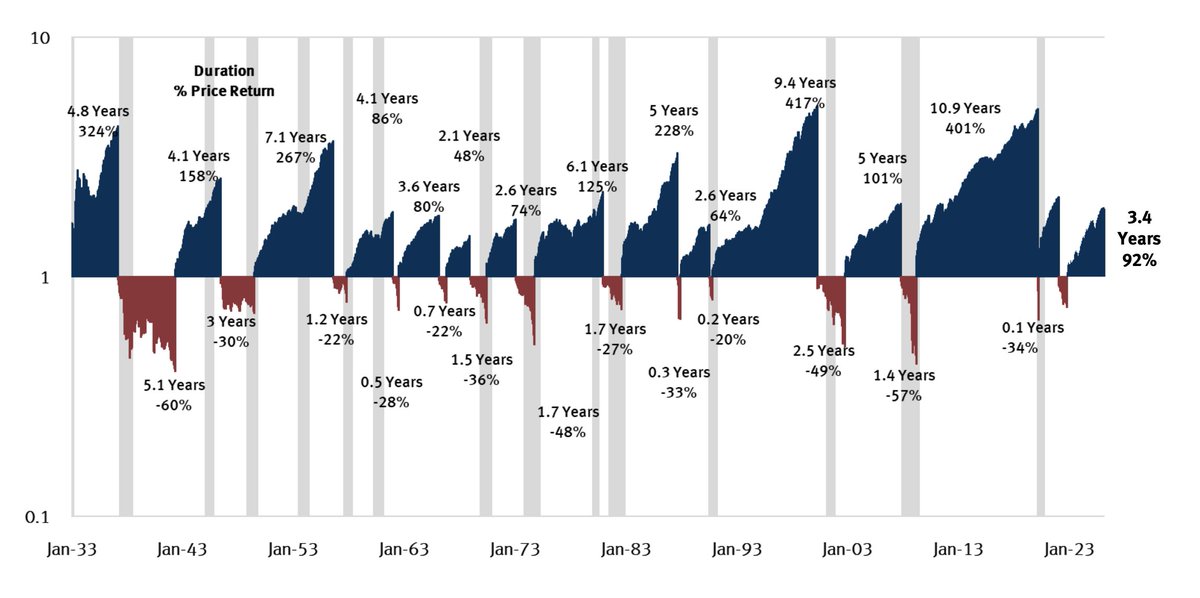
Before you panic, please remember, bull markets have historically lasted longer than bear markets and recessions.
The average U.S. Bull Market period lasted 4.9 years with an average cumulative total return of 177.6%.
The average Bear Market lasted 1.5 years with an average cumulative loss of -35.1%.
Just cover your balls and hold on to dear life, everything will be fine.
Monday has by far been the best day of the year in 2026.
We usually get good news over the weekend and this helps this day. Of course, then the rest of the week happens.
If you sold on Liberation Day – you missed 34% recovery in $SPX
If you sold on Silicon Valley collapse spring 2023 – you missed 78% in $SPX
If you sold on Covid in spring 2020 – you missed 198% recovery in $SPX