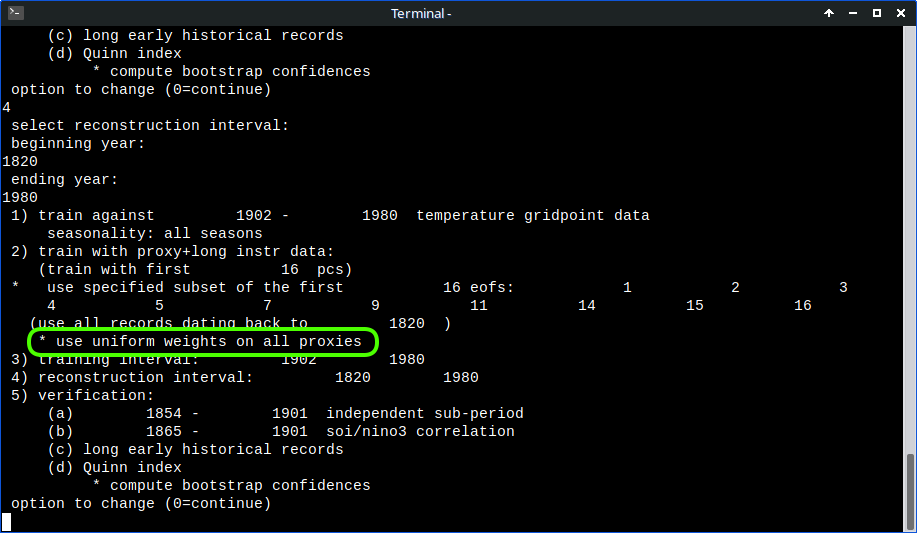
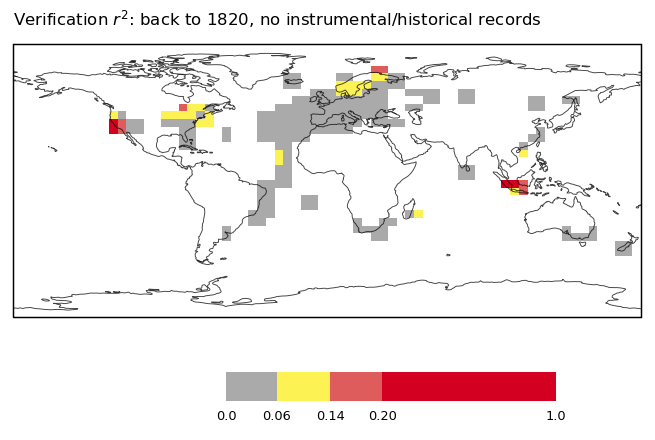
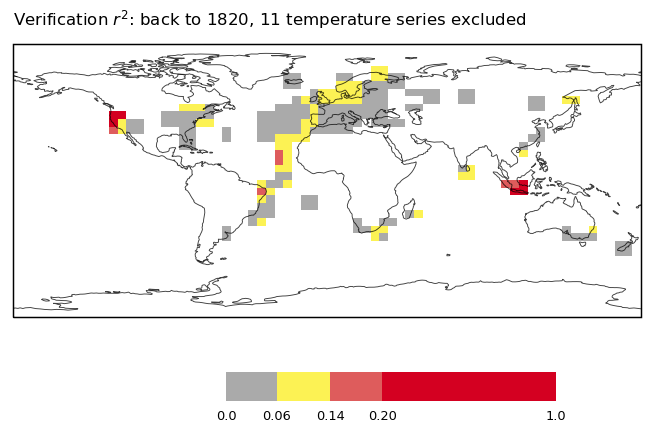
@Carl__P_ Mann falsely claimed (in the 2004 corrigendum no less) that he had applied a set of pre-specified weights to the proxy data.
Wahl and Ammann were misled by this claim.
@Carl__P_ It does look like an error in the calculation of verification r² was covered up. Assignments to amean1 and amean2 are written in a different style than the rest of the code block. There is also an awkward if-else statement.
Here is what I think the original code looked like.
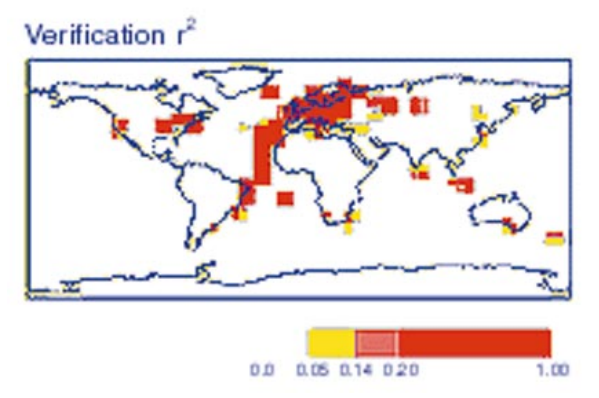
@ClimateAudit@RossMcKitrick By the way, the erroneous r² map appears again in the Earth Interactions paper. Seven authors and no one checked the calculations.
@ClimateAudit@RossMcKitrick Without sign-flipping, the post-1820 step has r² = 0.382.
WA speculate on why their verification RE scores are lower than MBH's. Maybe it's applicable to r² as well. I don't follow their argument.
@ClimateAudit@marcelcrok He probably did. There are 11 long temperature, 11 long precipitation and 2 historical series. 112-11-11-2 = 88.
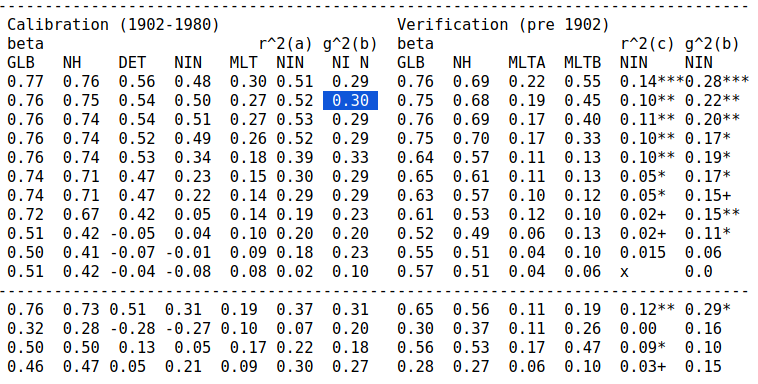
Calculated calibration RE values match, except for the detrended NH series. Might be a a bug. I think the published value is correct.
@ClimateAudit@marcelcrok MBH98 made a reconstruction where they excluded all instrumental (both temperature and precipitation) and historical records. Here is what I get.
@ClimateAudit@marcelcrok Excluding the 11 series listed in INSTR/TEMP/temp.loc and reconstructing the same set of temperature PCs (the selection is entered manually).
@ClimateAudit@marcelcrok The temp-1820-13.dat proxy almost perfectly tracks the instrumental target for that grid point in the verification period.
The large deviations in 1915 and 1955 are because MBH sign-flipped monthly anomalies below -10 degrees in the calibration period.
https://t.co/S9M4yxjExe
@ClimateAudit@marcelcrok Yes, the MBH diagram is for the post-1820 step. You are right that the statistical significance (in the corrected map) is due to the inclusion of instrumental temperature series in the proxy network. These only extend back to 1760. Before that, very grey maps.