New #dataviz! The Earth's submarine fiber optic cable network, visualized in #RStats with #rayrender.
Code:
https://t.co/6tFsS4vfAK
Rayrender Github:
https://t.co/iB5nWhGY7l
@therriaultphd I ended up doing all three of those during my PhD. My advisor always preached that ‘right now is as good a time as any’ and backed that up by actually being supportive when I needed it.
That said, had I been on this ‘path’ sooner -> likely no PhD in the US. Life is interesting.
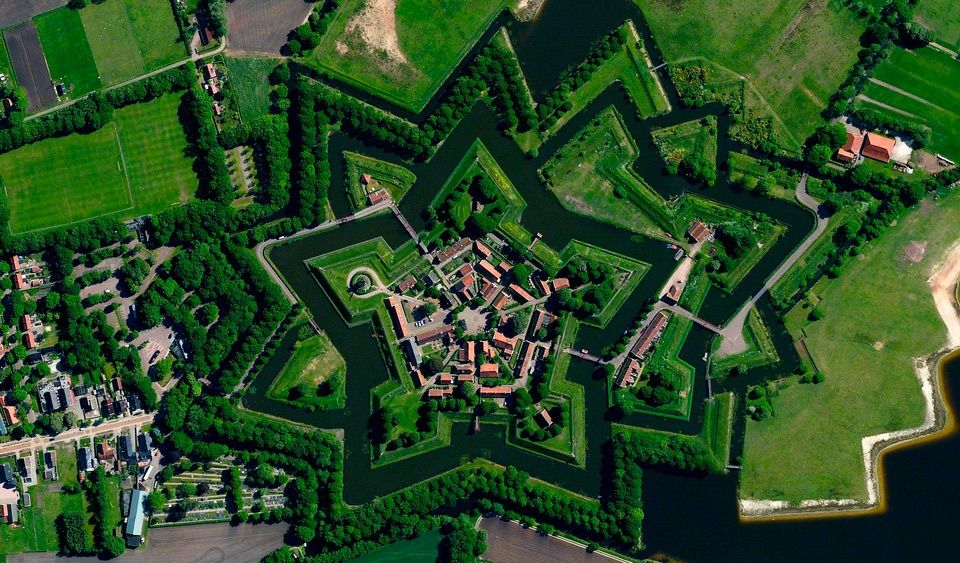
Midden-Delfland is one of nine "green buffers" enacted by the national government in 1958 to prevent Dutch towns and cities from sprawling into one another.
This 50 square kilometer zone between Delft and Rotterdam is protected for agricultural, ecological, and recreational use.
@vikramblings That's the harder one :-) Have thought about it, but never done it. Did a quick search and found this: https://t.co/4TLCGNK6uS
That uses google data to figure out driving times. I expect this approach can be adapted to show distances instead.
Applications are open for FB's Return to Work Program, a 16-week immersive program designed for those who have left the workforce for 2 years or longer and are looking to re-enter full-time. The program begins in late Aug, and positions are in the Bay Area, Seattle, and Boston.
@pdudders@observablehq@nytimes 3. Same as 2 but with discretized percentages (in 3 groups). Could have gone for a quantile plot, but don't think that would have added much more (we would have had 4 equal groups though)
WeWork friends, I'm looking to build a Data Engineering and Data Science team in NYC. I'm looking to add several ICs as well as a manager. Please DM to learn more.