Bull FIIs appear to be accumulating #Nifty in 23169–22890 range and aiming to lift it toward 23700–23800 zone in coming sessions.
SweeGlu Elliott Waves personalities often indicate what smart money may be planning before the news unfolds.
What your Analysis says?
Himanshu Jangra
- a middle class guy
- made an inappropriate joke
- lost his job
- He had a family to feed
- a single parent to take care of
- Right now spending sleepless nights regretting that one statement
Sejal Pawar
- made insensitive jokes about male cadavers
- KEM isn't taking any action
- Because she comes from a privileged rich family
- She got 420 out of 720 in NEET UG and still got selected in ST category
- She got success without any hardwork reason everything is just a joke for her
- She lost nothing and gained 200k followers which is all she wanted
- She kept trying for months to get fame in the name of cricketers and finally got it
One person lost his livelihood. The other will go back to live her lavish life tomorrow. This is India's so called equality for y'all 🙏
GMDA granted a 15-acre resort CLU to Rao Narbir (Forest Minister Haryana) in Gairatpur Bas Ag Zone.
4/6/26 #RTI reveals GMDA has NO knowledge of water/sewer lines there!
How can a massive commercial project be approved in a green zone without basic infra assessment?
Big environmental & civic questions raised!
#IRDA#Standard Chartered#DBSbank The real pressure by the bank to sell there Third class insurance products by the RM of a well known MNC banks just imagine what would have been the suitation in Indian Banks than.
#IRDA#Standard Chartered#DBSbank The real pressure by the bank to sell there Third class insurance products by the RM of a well known MNC banks just imagine what would have been the suitation in Indian Banks than.
Here's an non directional strategy and the formula for deciding the position size.
Strategy - Short strangle, sell 20 delta at 9:16 am with 30 delta SL on each leg (basically exit if a leg becomes ATM). Else exit at 3:25 pm
Win % 64, R:R 0.82
So, as per Kelly, position size is
(0.82*0.64 - 0.36)/0.82 = 0.2
So, 20% of the capital.
In the context of Nifty I will use only 20% of the margin I have to run this strategy. Approx 1 lot for 10 lacs margin.
Disclaimer- strategy is given only to illustrate position size.
#nifty 23366
#Giftnifty is down by 350 points, but we can not afford a close below 23150 in #nifty.
any gap down open on monday will have to be bought quickly.
Maruti is doing something the rest of the market isn't.
Holding.
Nifty bleeding. FIIs selling. Sentiment in the gutter.
And this stock keeps finding buyers at the same level. Three times.
That's not luck. That's a queue.
Now zoom out — descending triangle, compression tightening, RSI sitting at 50 doing absolutely nothing.
This is the calm before someone gets very right or very wrong.
Bulls: flat support at 12,800 has held every test. You buy the range, stop below 12,750, target 13,500 then 14,200. That's a clean 3:1 if you're not chasing.
Bears: every rally is making a lower high. The triangle resolves down 65% of the time statistically. A close below 12,750 and this thing sees 12,100.
Here's what neither side wants to hear —
The entry IS the trade.
Buying the breakout at 13,500? You just cut your RR in half and took on confirmation risk. Shorting the breakdown at 12,750? Same problem, opposite direction.
The people who make money on this move are already positioned or waiting at a specific number with a specific stop.
Everyone else is watching.
90% of traders will wait for "confirmation" — which is just a polite word for paying more and risking the same.
The chart doesn't care what timeframe you prefer. It only cares where your order is.
Where's yours?
#MarutiSuzuki #Nifty #RiskManagement
#Nifty is sitting on a crucial level right now.
One close below 23,200 and the chart opens up to 22,200.
One bounce and we're back to 24,500.
The next 2 weeks will decide everything.
What do you think ?
Is the next leg of the #GOLD bull market getting ready?
Gold corrected from nearly $5,500 to ~$4,350 levels which is a decline of ~21%, but what stands out is that buyers are defending the support zone again. The last 2 weekly candles have turned green, suggesting the panic selling phase may be fading.
Looking at the bigger picture, the Elliott Wave structure remains interesting. If this is still the larger Wave (iii) playing out, then a breakout above $5,500 could easily push gold towards $6,000-$6,500 before that wave is considered complete.
Could we then see a sharp Wave (iv) correction back towards $4,000-$4,500? Absolutely. Strong bull markets often shake out weak hands before moving higher again.
The fundamentals are supportive:
• Central banks have purchased 1,000+ tonnes of gold annually for 3 straight years
• Global debt is now above $320 trillion
• US debt has crossed $40 trillion
• Major central banks are still expected to cut rates over time
• Gold has outperformed most major asset classes in the last 5 yrs
From a technical perspective, gold is holding above its long term rising trend line, RSI has cooled significantly from extreme overbought levels, and momentum indicators are starting to stabilize.
I could be incorrect too, but overall this looks and feels more like a correction within a secular bull market than the start of a new bear market.
A move above $5,000 would be the first sign & a move above $5,500 could change things completely 📈
Disclosure: I remain invested in gold & continue to view it as an important part of my portfolio. This is not investment advice. Please do your own research!
2026 Was a Great Year for Stocks.
Benner Cycle predicted that 2026 would be a “Year of Good Times, High Prices and the time to sell Stocks and values of all kinds.”
Can an 1875 cycle prophecy be right in 2026? So far it was, but it is just 5 months behind us in 2026.
What is the Benner Cycle?
Samuel Benner, an Ohio farmer, published "Benner's Prophecies of Future Ups and Downs in Prices" in 1875, based on his analysis of historical economic patterns in agriculture, commodities, and business cycles.
The figure shows the original Benner Cycle chart. Apparently, the diagram was initially compiled by Tritch (1872), but it was not attributed to him.
What’s the accuracy of the Benner Cycle?
Dewey (1967), the Director of the Foundation for the Study of Cycles, assessed Benner's pig iron price forecasts and thought that they accurately gave “the years in which to buy, the years in which to sell. If you had used these dates for trading, your percentage gains between 1872 and 1939 would have been 50 times your losses!” He also regarded Benner's work as “the most notable forecast of prices in existence.”
Interesting analysis and attempted improvements by Frost and McMinn, including a 9/56 grid possibly correlated with the Moon Sun Cycle, are discussed in McMinn, D., 2022. Benner Cycles & the 9/56-year grid. Cycles Magazine. Vol 51. No 5. p 8-29.
Note: A rigid calendar application of the Benner Cycle has a mixed record, but adding or subtracting a year or two yields remarkable results. One should realize that some cycles vary over time but generally return to their stable state. Their accuracy and duration are also affected by shorter and longer cycles, as well as “random” events such as new technological breakthroughs.
Heartbroken Surya Chauhan’s friend on Stabbing of Surya by Jihadists💔
“Our mother gives birth to 1/2
She doesn't give birth to a herd of 10 pigs like their mother.”
“If one gets sacrificed, it doesn't make a difference to them.”
Wake up Hindus🙏
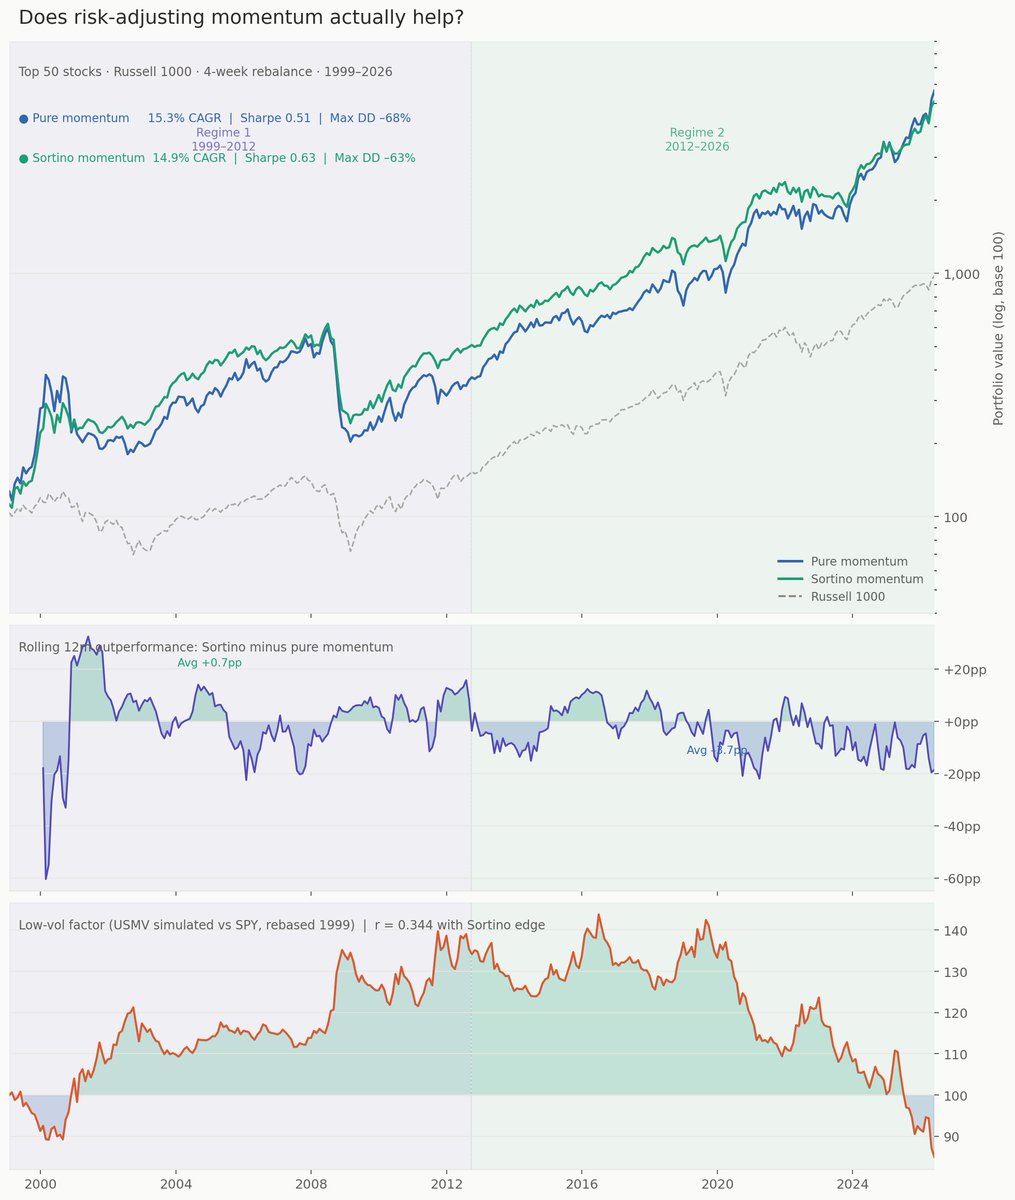
The same momentum formula. Two completely different strategies.
I ran a test on the Russell 1000 (50 stocks, 4-week rebal, 1999-current)
Two momentum signals, built on the same 12-1 month lookback:
➡️ Pure price momentum: just rank by trailing return
➡️Sortino-adjusted momentum: divide that return by downside volatility
Here's what the numbers show.
▫️ Pure momentum: 15.3% CAGR, Sharpe 0.51, max drawdown –68%
▫️ Sortino momentum: 14.9% CAGR, Sharpe 0.63, max drawdown –63%
On the surface, the risk-adjusted version looks like the clear winner. Better Sharpe, lower drawdown, cleaner IC across(not shown here).
But now split the history in half.
🔷 1999–2012: Sortino momentum wins by a small margin. Two major crashes punished volatile high-flyers. Filtering by downside risk actually saved you something.
🔶 2012–2026: Pure momentum wins — by an average of 3.7 percentage points per year. In a low-drawdown, trending bull market, the "volatility penalty" you're filtering out is exactly the kind of upside volatility you want exposure to.
So which formula is better? Neither. They're measuring different things.
Now here's the part I found more interesting. I overlaid the relative performance of USMV (the iShares minimum volatility ETF) versus the S&P 500 over the same period.
The correlation between the Sortino advantage and USMV outperforming the market was 0.58.
The lesson?
When low-volatility is in favor as a broader market theme, smoothing your momentum signal by downside risk adds value. But when markets are trending hard and low-vol is lagging (since 2012) then pure price strength wins.
Formulas matter. Regimes matter. There is usually not 1 clear winner all the time.
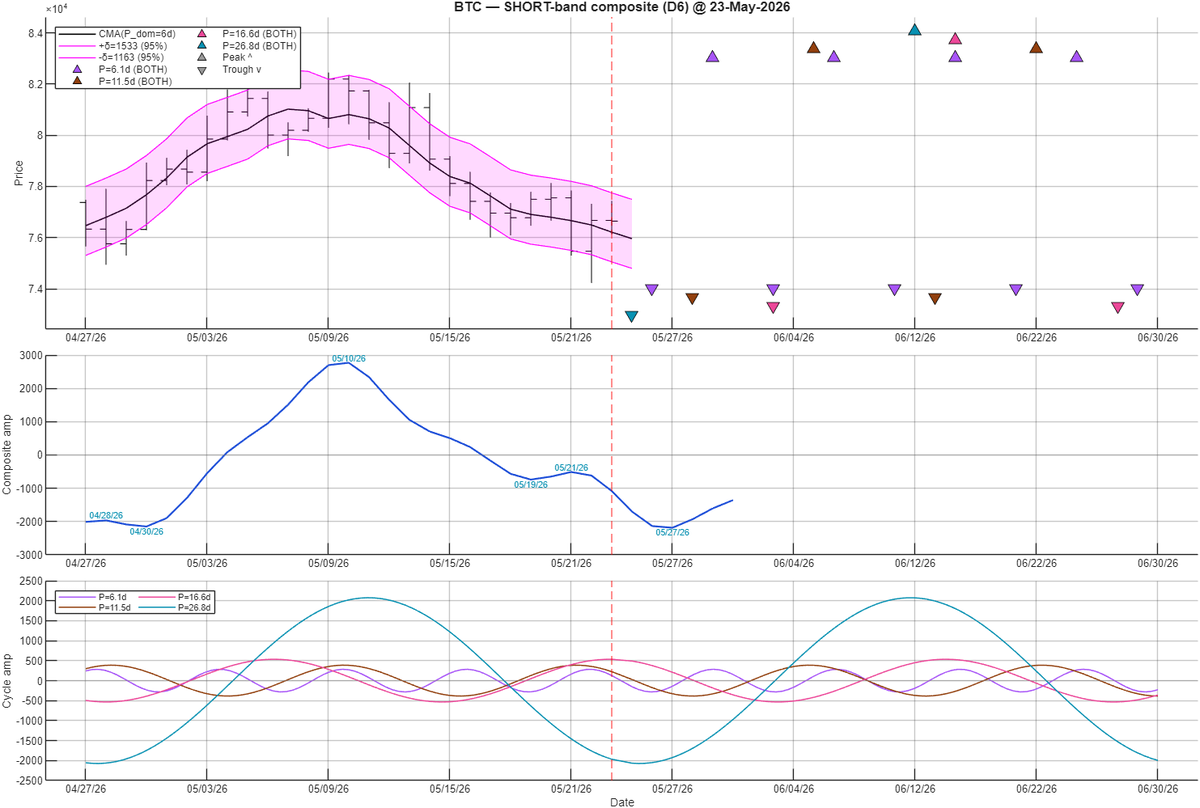
Bitcoin Short Cycles
Short cycles, up to 27 days, should turn up within a couple of days.
For the detailed crypto and stock market analysis, check out the latest Market Twists & Turns Pro newsletter.
🧵Indian investors hit two walls when they try to invest globally:
▪ Domestic international MFs are stuck at SEBI $7B aggregate cap
▪ Direct foreign brokers (IBKR, Vested) put your custody under foreign law
GIFT City is the third route. The Missing Manual most haven't read👇
₹1 lakh invested in Niftybees in January 2008 is worth ₹4.43 lakh today. 8.45% CAGR over 18 years.
That same ₹1 lakh, switched between Niftybees and Goldbees using one trading rule, became ₹20.84 lakh. 18% CAGR.
Here's the strategy details 🧵
5yr P/E ratio isn't the only thing that you should factor in for global investments. Markets follow earnings in the longer run...
At India Macro Indicators, we have evaluated 28 countries based on these ratios:
🔹PE
🔹CAPE
🔹Forward PE
🔹5yr historical PEG
🔹Forward PEG
https://t.co/SZqts8vIu5
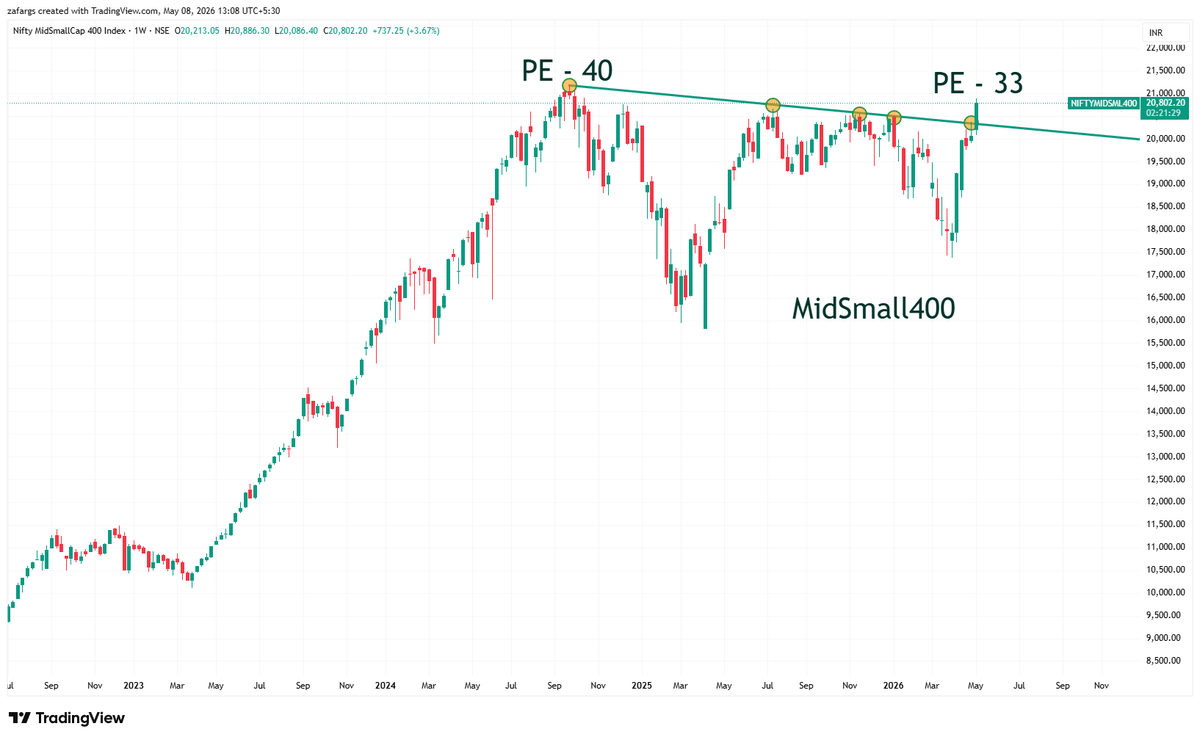
Maths Question : IF #MidSmall400 Euphoria PE is 40 , Current PE is 33 & 12M forward earnings growth expected at 20% , what should be tentative upside in 12+ months?