$ISRG has been forming a bullish double bottom on the weekly chart near the 61.8% Fibonacci support.
Price is now testing a key technical zone where buyers could step in. A breakout above the neckline would add confirmation to the setup.
Watching this one closely. 📈
#ISRG
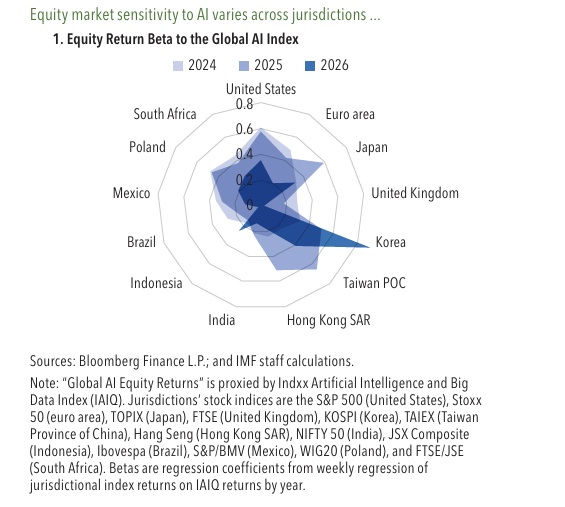
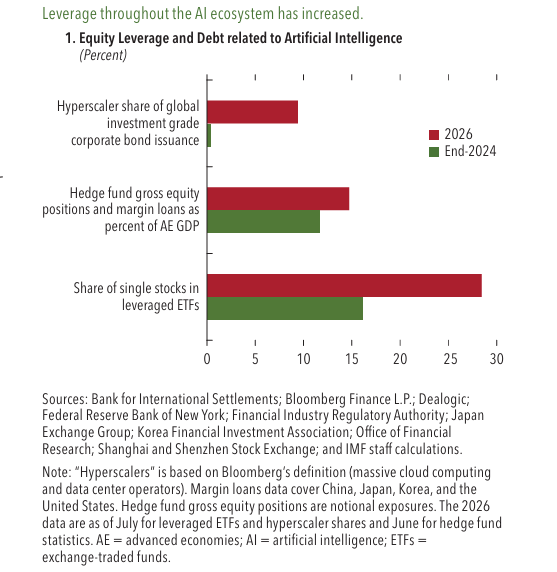
Some markets are more sensitive to AI than others. Advanced Asian markets have high exposure. Many countries have also increased their holdings of U.S. stocks, which are heavy with AI companies.
.
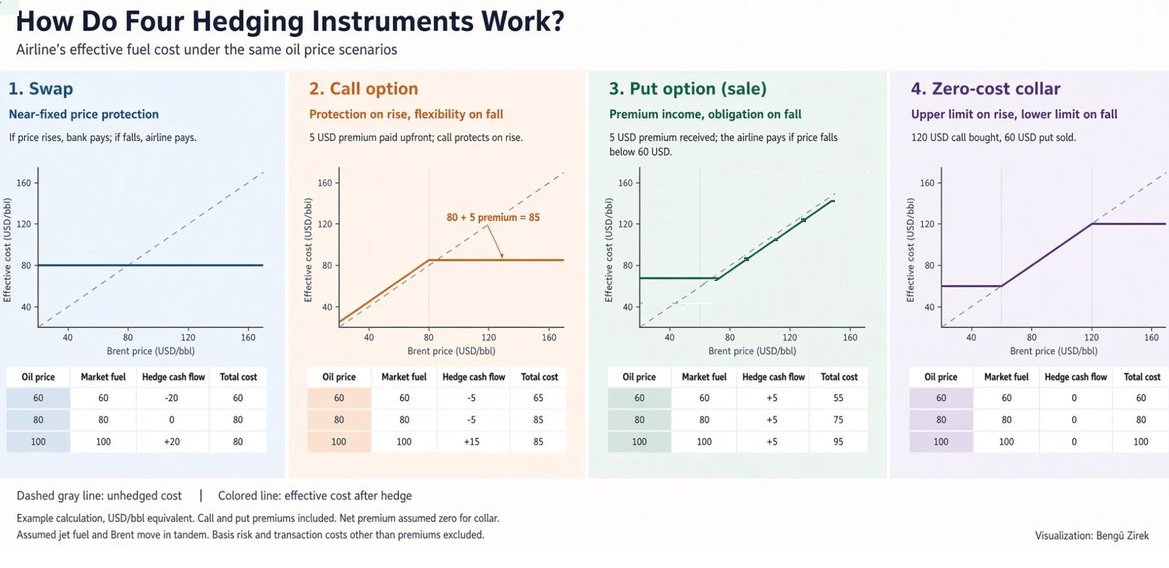
Hedging instruments: a very informative chart that deserves to be saved by @benguzirek
The chart shows how four common tools affect an airline’s effective fuel cost under different oil price scenarios as example.
1. Swap: Locks in a near-fixed price. If oil rises, the bank pays the airline; if oil falls, the airline pays the bank. The effective cost stays roughly flat around 80 USD/bbl.
2. Call option: Protects against rising prices while keeping the benefit if prices fall. The airline pays a 5 USD premium upfront. Above the strike, the cost is capped, below it, the airline pays the market price plus the premium.
3. Sold put option: The airline receives a 5 USD premium but takes on an obligation if prices fall. Below 60 USD, the airline must pay the difference. This lowers the cost when prices stay high but increases exposure when prices drop sharply.
4. Zero-cost collar: Combines a bought call and a sold put so the net premium is zero. It sets an upper limit (protection against big rises) and a lower limit (the airline gives up some benefit if prices fall a lot). The effective cost stays within a defined band.
In short:
Swap = fixed price
Call = protection only on the upside
Sold put = premium income with downside risk
Collar = range protection at little or no upfront cost
A clear visual of how airlines manage fuel price risk.
Not: Of course, these examples are in a theoretical framework. In practice, there may not be sufficient trading volume in the put or call at the desired strike levels.
Indonesian market return since 1995
In 1995 Indonesian index is around 513.85
Currently it is around 5000
30 year return around 10times. or 100%. Sounds alot?
Compound Annual Growth Rate (CAGR) of 2.34%
Maybe fix deposit can return more than that?
Since Rupiah depreciate alot in the last 30 years. If calculate base on USD:
1995 USD to IDR 2308
Current USD to IDR 18000
If international investor use USD to invest in Indonesian stock index back in 1995 and convert back to USD curently, 30 years return is just around 30%. CAGR only 0.88%.
Looking for both bullish and bearish scenarios doesn’t mean I’m undecided. It means I want to be prepared.
The quality and growth of a company matter, especially for a long-term investment. But when I’m charting, I can’t expect price to follow the lines I draw or the targets I calculate.
I’m looking for areas where price could react and what would strengthen or weaken each scenario.
What happens if support holds?
What changes if it breaks?
What would confirm a breakout, and what would suggest it failed?
Sometimes the structure tightens enough that a move looks closer, but that doesn’t tell me which direction it will take.
Mapping out both sides helps me plan potential trading entries and exits, identify areas to consider adding to long-term holdings, and decide how much size I’m comfortable taking, and when.
The chart isn’t a guarantee. It’s a framework for making decisions as price develops.
I’d rather prepare for multiple outcomes than get attached to one.
AI has supported growth and company profits, but leverage (borrowing) across the AI world has grown. Hyperscalers are issuing more bonds, hedge funds are more leveraged in AI stocks, and people are buying leveraged ETFs.
If AI spending or profits disappoint, forced selling could make the drop bigger.
Source :- IMF Global Financial Stability Report
@teechongyen Signs of a structurally weak market. It would be interesting to see the data of how much local institution and MFs bought in last 2-3 years.
@RayDomFinance Yeah. Looking to buy some pharma and associated sector stocks. Let me know if something comes on your radar. Already started creating small positions in $CVS and $ISRG.
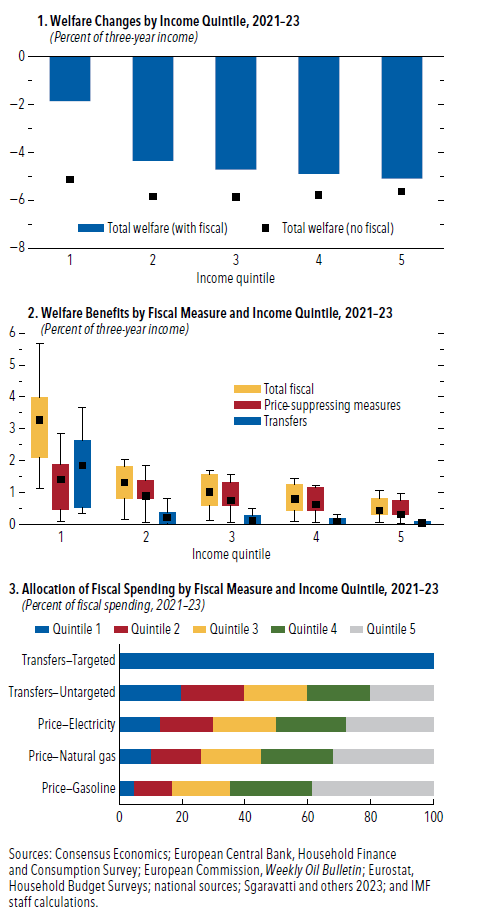
In Europe the support packages did ease the pressure, particularly for families at the bottom. Yet when governments spent money to hold down electricity and fuel prices, a large share of that spending quietly flowed to higher-income households who were driving more and using more energy.
Source :- IMF World Economic Outlook
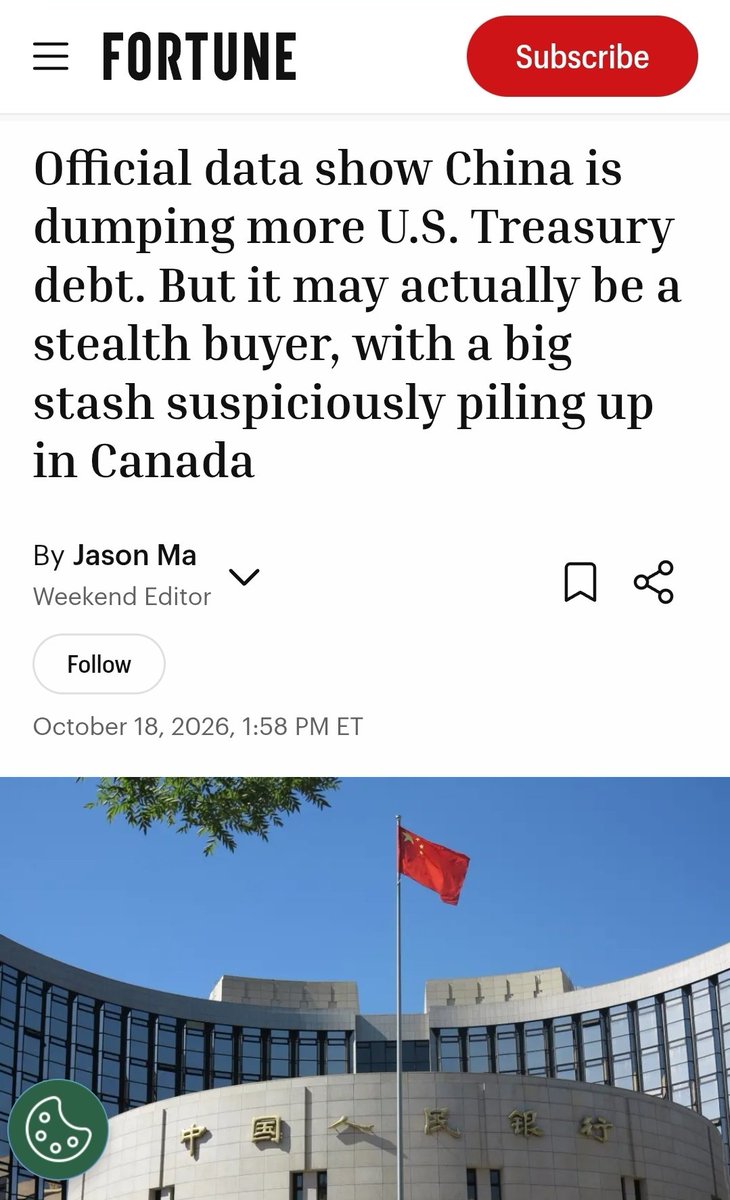
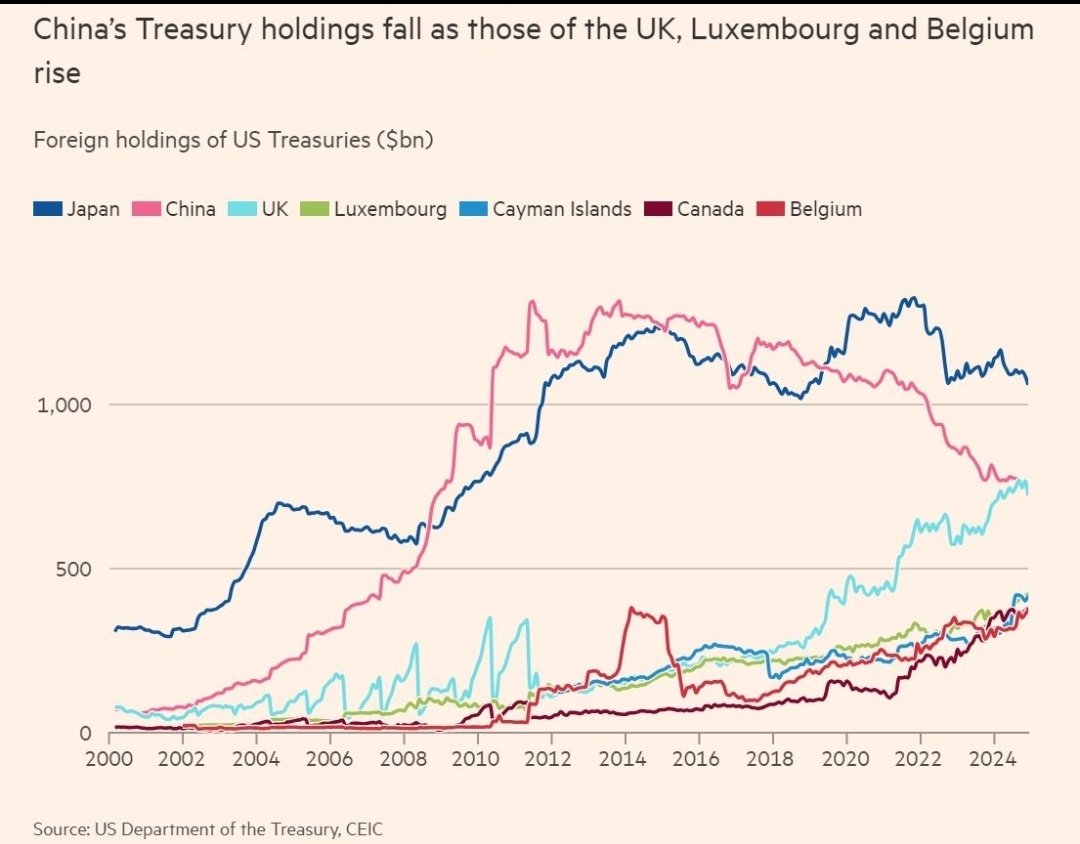
Is China secretly buying US Treasuries through third countries?
While China's direct Treasury holdings have declined, FT chart shows rising holdings in Luxembourg, the Cayman Islands and Canada.
Could some of China's exposure be hidden behind overseas custodians, or is this simply a shift in global capital flows?
The data raises an interesting question. 👀
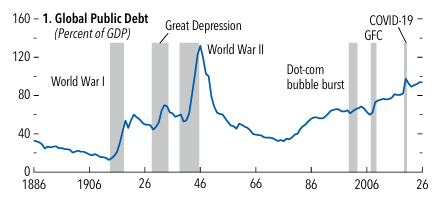
One reason the global economy has absorbed recent shocks is that governments used fiscal space. Debt has risen after big shocks for a long time, and the post-pandemic period followed the same pattern. Primary deficits stayed large and debt-stabilizing balances are now higher than most countries currently plan.
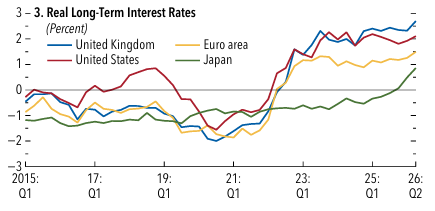
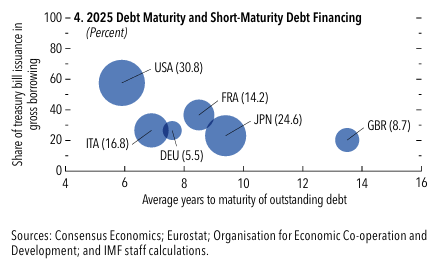
Real long-term rates are up, maturities are shorter, and refinancing needs are bigger. Windfalls from energy or tech have often been spent instead of saved. That leaves less room to cushion the next hit.