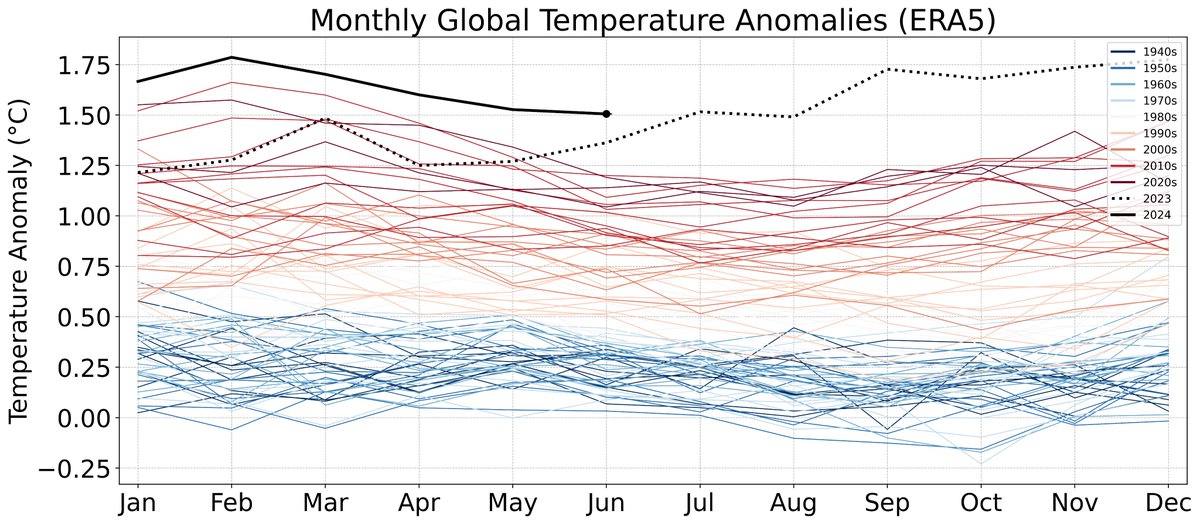
I've created a new dashboard for The Climate Brink that is updated daily with ERA5 global mean surface temperature data. It includes daily anomalies, monthly and annual forecasts, and a bunch of interactive data visualizations: https://t.co/xXrvY4KFB3
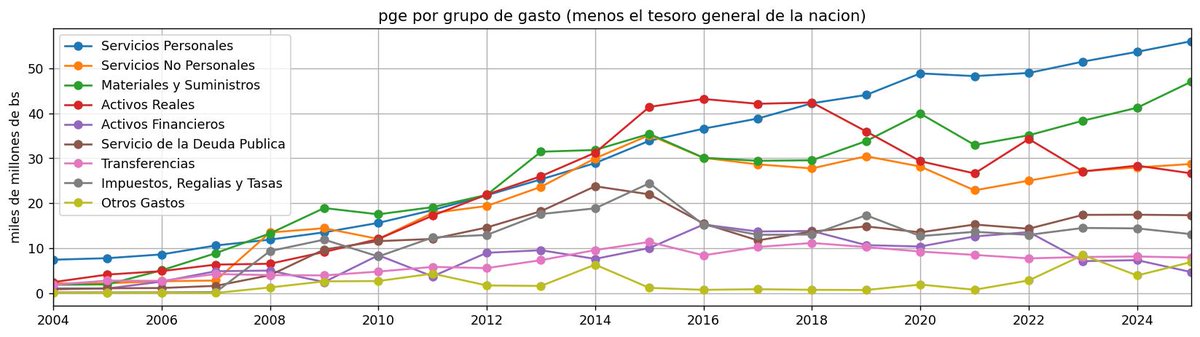
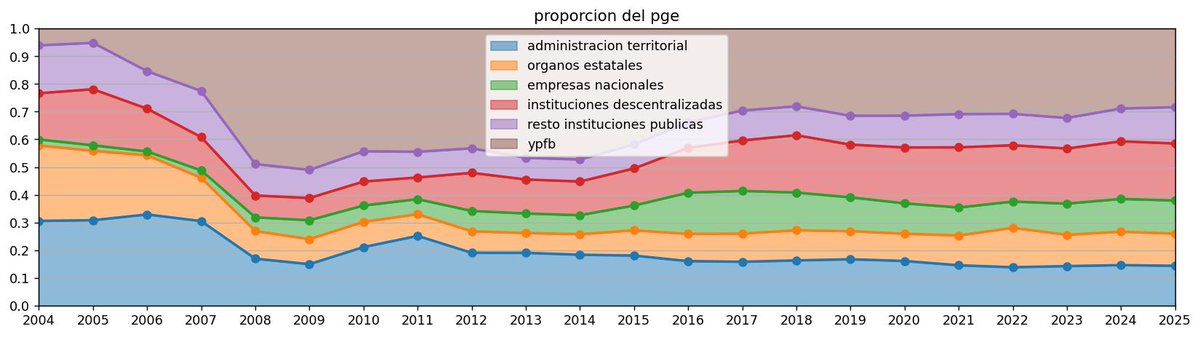
Usando datos de SIGMA/SIGEP compile una copia del presupuesto general del estado 2004-2025, desagregado por quien gasta y en que. La politica mueve prioridades, las prioridades mueven la distribucion del presupuesto, y esa distribucion moldea al Estado.
Va hilo lleno de graficos
Global temperatures were extremely hot in June 2024, at just over 1.5C, beating June 2023's previous record-setting temperatures by 0.14C and coming in around 0.4C warmer than 2016 (the last major El Nino event).
Now 2024 is very likely to beat 2023 as the warmest year on record
@NohelyGuzmanN Hola Nohely, ojo que estos datos son de hace 8 días. Desafortunadamente nuestra fuente (UDAPE) ya no está subiendo sus reportes diarios, pero esperamos que retomen pronto :)
@MuyWaso Según @extremetemps, 6 localidades en Bolivia rompieron records de temperatura el 2020:
Robore max. 42°C
San Matias max. 43.3°C
San Jose de Chiquitos max. 43.3°C
Ascension de Guarayos max. 41°C
San Javier max. 40°C
Rurrenabaque max. 41.3°C
https://t.co/OeiozgU5qh
🟢 The peeps at @Carbon_Monitor recently updated their fantastic dataset covering *daily* CO2 emissions for many major countries of the world (latest update: Jan 2019 to February 28, 2022).
Figures and data are now updated on our website too. Lets take a look!
Thread🧵