I created this infographic with R and Illustrator for #MakeoverMonday week 14.
It was really nice figuring out all the different features of beans and trying to make it easier to understand.
Happy to hear feedback from #MMVizReview.
SO MANY GREAT approaches to visualizing qualitative data are being shared in the current #SWDchallenge. Here are just a few of the latest #dataviz shared by @thedesolalasisi, @dieuwbieus & @rashdesign. Explore these + many more! https://t.co/BwItw9owzI
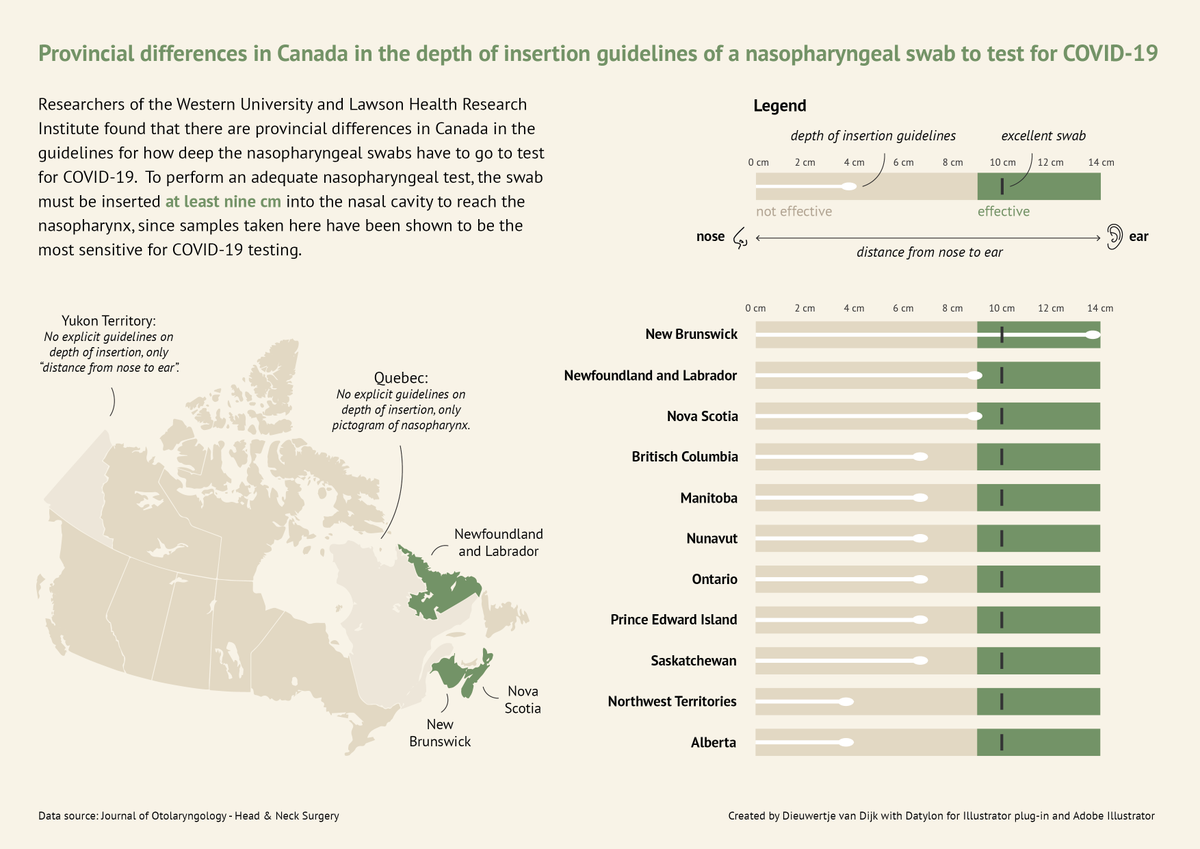
For my first #SWDchallenge, I created a bullet chart and map of the differences in guidelines in Canada for swab tests for COVID-19.
This #dataviz was created with Datylon for Illustrator plug-in.
@storywithdata
I created this infographic with R and Illustrator for #MakeoverMonday week 14.
It was really nice figuring out all the different features of beans and trying to make it easier to understand.
Happy to hear feedback from #MMVizReview.
Thank you for the feedback @TriMyData! I really liked the idea of putting small icons next to the chart titels 🤗
Here is the revised version of my #makeovermonday week 14 chart :)
@TriMyData@VizWizBI @menscuriosa @data_ek@kbienio_ @DenHoyle Thank you for picking my data visualization and for the feedback this week 😍 Looking forward to next week 🥳
Thank you for the helpful feedback @TriMyData during #MMVizReview 🤗
Here's my adjusted version of my data visualization for #Makeovermonday. I Also tried the vertical version of this chart but that didn't work out as I wanted 🤔
https://t.co/Xql21aTU7o
🤗 Happy International Women's Day! 🤗
I created this visualization for week 10 of #MakeoverMonday. It was so nice to learn so much about these women competing in the Olympic Games.
Link to visualization:
https://t.co/LrcqhRpMtM
Happy to hear feedback #MMVizReview
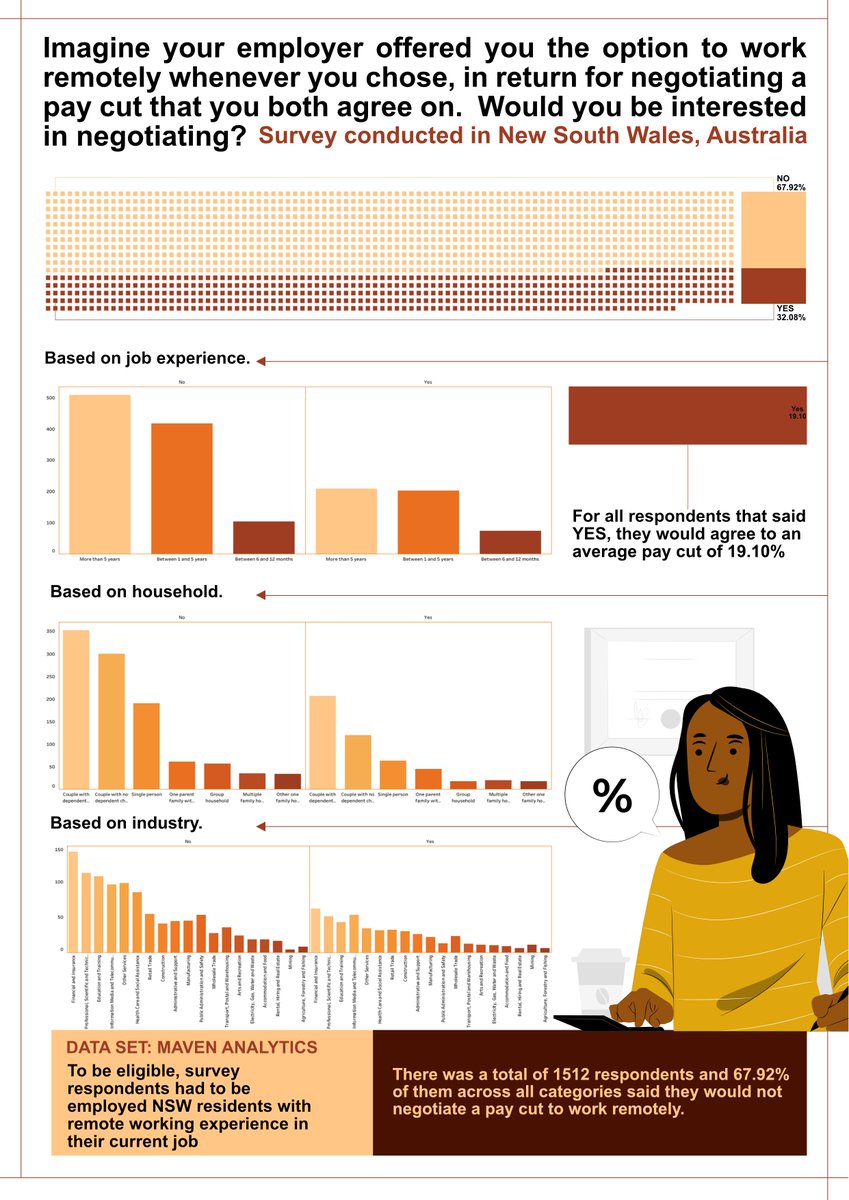
My submission for week 9 of #MakeoverMonday. This week I challenged myself to make a creative data visualization.
Curious what you think and looking forward to feedback from #MMVizReview.